OPEN-SOURCE SCRIPT
Rainbow Stochastic
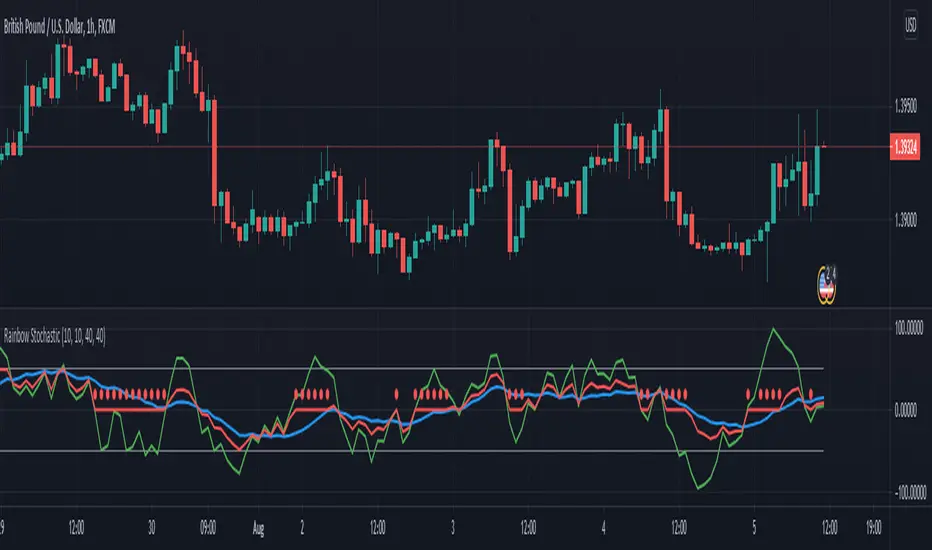
Rainbow Stochastic is a unique indicator which shows the overbought and oversold levels. Green line is fast Stochastic where as the blue line is a slow Stochastic.
Over bought is generally +50 and Over sold is generally -50. To edit the lookback change the Lookback of Fast and Slow. 20 is ideal for Fast and 40 ideal for Slow.
Over bought is generally +50 and Over sold is generally -50. To edit the lookback change the Lookback of Fast and Slow. 20 is ideal for Fast and 40 ideal for Slow.
Skript med en öppen källkod
In true TradingView spirit, the author of this script has published it open-source, so traders can understand and verify it. Cheers to the author! You may use it for free, but reuse of this code in publication is governed by House rules. Du kan ange den som favorit för att använda den i ett diagram.
Frånsägelse av ansvar
Informationen och publikationerna är inte avsedda att vara, och utgör inte heller finansiella, investerings-, handels- eller andra typer av råd eller rekommendationer som tillhandahålls eller stöds av TradingView. Läs mer i Användarvillkoren.