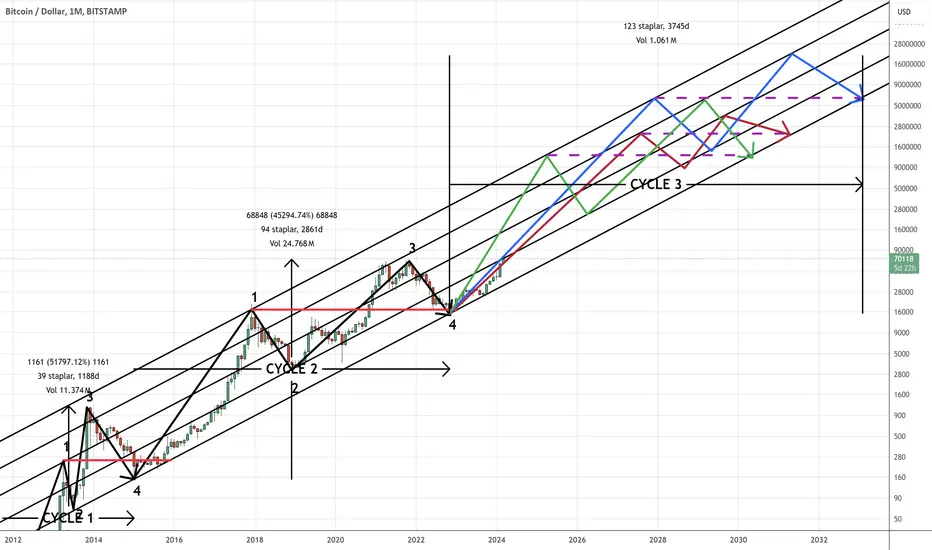
Bitcoin HTMBS™ (Högst Tvivelaktig Mega Bullish Spekulation ™)Har suttit och roat mig med att försöka kartlägga Bitcoins historiska cykler och prisutveckling.
Notera att min framtida projektion mest är på skoj och som syns mega-bullish, men den visar tre potentiella banor priset skulle kunna följa om BTCUSD skulle få totalt frispel och fortsätta röra sig mel
Nyckeltal
Om Bitcoin
Bitcoin är världens mest omsatta kryptovaluta och utgör den största delen av kryptomarknaden. Det var det första digitala myntet och är fortfarande den mest kända och allmänt accepterade kryptovalutan i världen. Det är pionjären i vars fotspår alla andra mynt följer. Bitcoin var uppkomsten av en helt ny tillgångsklass och ett stort steg bort från traditionella, centralt kontrollerade pengar. Idag tror många förespråkare att Bitcoin kommer att underlätta nästa steg i det globala finansiella systemet, även om detta naturligtvis återstår att se.
bitcoin longtermmin teori går på att vi kommer att ha en korrektion till 48 000 $ i april maj/juni sen upp mot ca 140 000 $/160 000 $ och toppar i dec 2025/ jan 2026. därefter en lång bearmarket

tror bitcoin kommer ta nya ath kommande tidtycker mig se att bitcoin formar sig fint för att ta nya ath. skulle vi se en rörelse ned till zonen kommer jag fylla på mycket vid en fin reaktion.
Bonus: eth kommer också ta ath ;)

btc longtermjag tror fortfarande på ett leg ner för en våg 5 ner men priset får absolut inte ta 2019 toppen ca 14 k samt priset ska inte överstiga 32 k innan en våg ner under 17700 $
som jag beskriv i 2 andra alt tidigare i början av 2022 så har jag hela tiden förutspått att runt sep-dec 2022 kommer botten var
BTC PART 2 -> MORE LIQUIDITYWe already know the scheme and are among those who think like a market maker. What would you do as a bank seeing all this delightful liquidity resting at the 40K range with an even more downside to 37 - 38K to do one more flush before heading to next upward zone

btc longterm (2 alt)det finns två alternativ för btc antingen fortsätter vi på 4 års cykels mönstret vilket är blåa alternativet då vi går för blue top off eller enligt 16 års cykel får vi det röda alternativet vilket påpekar att våg 1 är satt och nu är vi på abc delen av korrektionen
återstår att se, cykel analys visa

#BTC 🔴 H1 SHORT (BITCOIN) Eventuellt W1 PPR ⬇️Intressant utveckling inom Bitcoin. Det verkar som att de försökte bryta igenom 31k flera gånger, men samtidigt löste sig 30k-motståndet många gånger.
Men den sista kraftfulla impulsen mot bakgrund av FUD tog stopp för alla longister, som envist fick sina positioner i LONG under lång tid.
Vi har rör

the worth senario for bitcoinom man ska ta hänsyn till cykel analys så är absoluta toppen är inne och vi har inlett bear market och ingen våg 5 kommer att vi se ( bara ett senario), detta senario kommer ske om vi inleder en recession period, men som sagt så har jag två alternativ som jag postat tidigare i december 2021

BTCUSD KartaSe bild. Inte krångligare än såhär! Håller stödzon och eller trendgolv så väntas uppgång. Jag är bullish. Även på lång sikt.

Bitcoin BTC stor stigande kanalDen storskaliga stigande kanalen för Bitcoin BTC är för närvarande på det nedre spåret av den stora kanalen och är nära mittspåret. Den kommer så småningom att bryta igenom mittspåret och nå en ny höjd på det övre spåret.

Se alla ideér