Indikatorer, strategier och bibliotek
Hello All, This is Ichimoku Oscillator that creates different oscillator layers, calculates the trend and possible entry/exit levels by using Ichimoku Cloud features. There are four layer: First layer is the distance between closing price and cloud (min or max, depending on the main trend) Second layer is the distance between Lagging and Cloud X bars ago...
Library "gFancyMA" printLbl(y, x, c, m, b, s) Parameters: y (float) x (int) c (color) m (string) b (bool) s (string)
"ChArt Path" shows the same datas as the candles, but as a channel, instead of individual candles. It allows to focus on the direction of the price (instead of wondering the meaning of each candle), which hopefully simplifies the analysis, and reduces the confusion. Also, it is artistically customizable! A little time might be necessary to get used to this...
PrevHighLow Trend Indicator which is calculated by using prev lowest and highest of p1 -period and p2 -period for two MAs. First MA is made of prev highest of p1-period / prev lowest of p1-period. Second MA is faster, made up of p2(<p1)- period(same formula). Can be used in the next way: slower MA(straight line) shows main trend, faster shows temporary...
This code was written using: •Pine Script Coding Conventions. This script provides a very useful tool for new community users and professionals. It puts at your disposal a Moving Average Ribbon by hand to graph and easily find the ones with the highest performance. The creation of this script was motivated because in free TradingView accounts there is a limit...
ENGLISH & SPANISH ------------------------------------- ENSLIGH The idea was initially inspired in the concepts shared by @LazyBear on his indicator "Better Volume Indicator" (). But I found it somewhat complicated and dull. So I came up with this. Concept: It changes the color of volume bars based on surrounding volume changes. Volume changes are...
For those that want technical ratings but don't want waste valuable screen real estate. Candles are colored to the rating strength. It also plots the results for "total", "MA" and "other" in a table on right of screen. Table and candle coloring can be turned off in style settings. This script uses the built in Technical Ratings indicator. For more informations on...
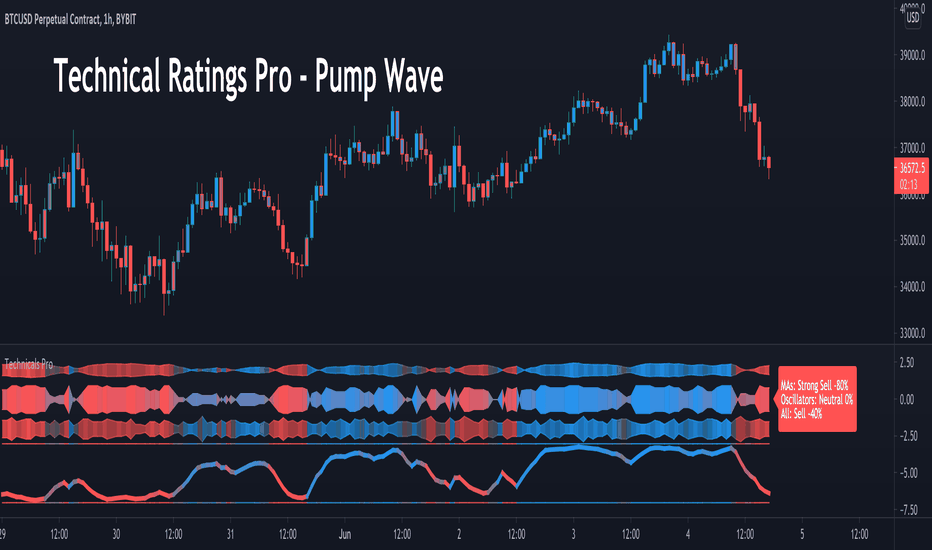
This script uses the built in Technical Ratings indicator but interprets the data visually. It plots the results for "total", "MA" and "other" as pump waves. It uses MA to plot a trend line (can be turned off in settings) . Candles are colored to the rating strength and a percentage number was added to the results. For more informations on the Technical Ratings...
This indicator colors the volume bars and candles according to the volume traded. The calculation of the heat map zones is done as follows: how many standard deviations the volume are distant from the average volume? For a better visual experience, place the borders and wicks of the candles in a neutral color.
easy to analyse rsi in chart manner, it will show you red color whenever rsi cross 70 or 30
What you see is the 100 day moving average (blue line in the middle) with percentage bands attached to it. Each color has a 5% range. The brightest green color is 20%-25% below the 100 day moving average. The brightest red color is 20%-25% above the 100 day moving average. The behaviour of the stock price between the bands could give you trading ideas. The...
This script can display a lot of different volume statistics. It also colours bars depending on a chosen, customisable criterion. Most options are disabled by default and can be reenabled in the settings menu. FAQ Why are the bars slightly higher than the default volume bars? Due to the limitations of Pinescript. What are the two last values (including the...
A simple script to add background colors to specific timeframes. Great for trading futures so you can separate sessions for easier viewing. Use for stocks to separate pre, open, and post market times. There are three timeframes that can be set and all colors can be modified.
Hello traders Today is a Pinescript hack to display multiple colors in one label. I used that panel to show the Supertrend Long Term values (weekly, monthly, quarterly, yearly) What is a Supertrend? Definition : SuperTrend is an indicator that works on all timeframes and all instruments (stocks, futures, forex, ...). It is a great tool to follow market...
This script plots 10 exponential moving averages and marks the areas between them. The lengths are Fibonacci numbers starting from 5 and ending with 377. The colors indicate the length of the moving average, green for the shortest and purple for the longest. The zones between consecutive EMA's (e.g. 5 and 8 ema ) are market according to the color of the greater...
Introduction This indicator can have a wide variety of usages, and since it is based on exponential averaging then the whole indicator can be made adaptive, thus ending up with a really promising tool. This indicator who can both smooth price and act as a trailing stop depending on user preferences, i tried to make it as reactive, stable and efficient as...
The Elder's Force Index is an oscillator that takes into account the change of the price combined with the volume: EFI = (close of the current day - close of the previous day) * volume of the current day If measure the force of the price change. If you calculate the exponential moving average of the last two days to smooth the signal EMA(EFI,2), you have a...


![Moving Average Ribbon [TheBearFighter] BTCUSD: Moving Average Ribbon [TheBearFighter]](https://s3.tradingview.com/s/SBUQ15FO_mid.png)

![SVA - Simple Volume Analyzer, by BlueJayBird [bjb] BTCUSDT: SVA - Simple Volume Analyzer, by BlueJayBird [bjb]](https://s3.tradingview.com/g/G4YdC6vT_mid.png)


![Heatmap Volume [xdecow] BTCUSDT: Heatmap Volume [xdecow]](https://s3.tradingview.com/u/unWex8N4_mid.png)


