Om Guld / USA-dollar
Guldpris följs i stor utsträckning på finansiella marknader runt om i världen. Guld var grunden för ekonomisk kapitalism i hundratals år tills upphävandet av Guldstandarden, vilket ledde till att fiat-valutasystemet utökades, där papperspengar inte har en underförstådd uppbackning med någon fysisk form av monetarisering. AU är koden för guld på den periodiska tabellen över element, och priset ovan är Gold citerat i amerikanska dollar, vilket är det gemensamma värdet för att mäta värdet av guld över hela världen.
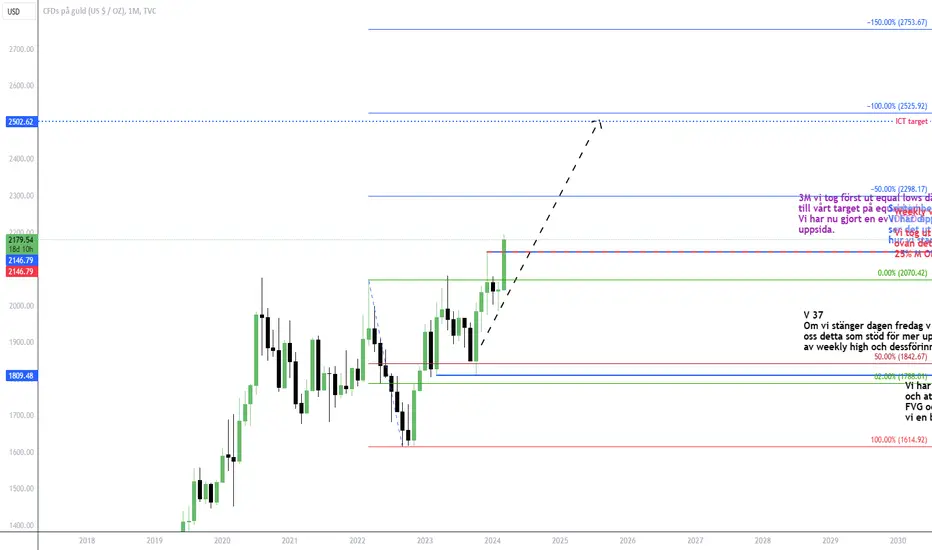
Guld - Stor potential Guld står inför en väldigt spännande tid!
Vi ser att vi blandannat hade 5 år bear market där det tog priset över 10 år att återhämta sig ifrån 2011! Detta skulle kunna vara en så kallad cup and handle formation.
Bryter vi nuvarande konsolidering tror jag på otroligt stora uppgångar i guldet! Min

Powell antyder ytterligare 2 höjningar, sänker guldet Powell antyder ytterligare 2 höjningar, sänker guldet
Den amerikanska dollarn steg på onsdagen efter mötet mellan centralbankschefer världen över, där Federal Reserves ordförande Jerome Powell ingick. Under mötet lämnade Powell möjligheten öppen för att Federal Reserve genomför ytterligare två rän

NFP-rapport: Hur kommer det att forma Guldtrenden?NFP-rapport: Hur kommer det att forma Guldtrenden?
Guldpriserna upplevde en ökning på tisdag och torsdag (sidled på onsdag), driven av handlarnas förväntningar på en annan räntehöjning av US Federal Reserve. Men är den medellånga nedåtgående trenden verkligen över?
En grundläggande indikator som k

Guld trade med hög sannolikhet.Lägger upp en analys som jag gjort på XAUUSD (GULD)
Analysen är baserad på en hög sannolik stödzon och min prognos är att den kommer gå upp väldigt hastigt under dagen.
Guldpriset just nu: 1947.50
Mål: 1953.33

Strategi Idea: Back test video av NYC och H & L av P. day Grå färgat områden vertikal: Support and Resistance i struktur time frame
* 25.01, 2023
* 23, 03, 2023
* 13, 04, 2023
Grå färgat områden Horisontell: NYC Trading session
Röda färgat områden är New York close område
Röda line är high av previous day
Grön line är low av previous day
Back test från 2

GOLD - Long SetupFår vi lite pump i DXY kan denna nog falla en bit till, men en retest på 1950 innan nästa leg upp ser rätt bra ut. 50DMA ligger där också. Beror på hur mycket risk off vi har i dollarn och räntor men låt se.
Invalidation 1930
T1: 2074 (6R trade)

XAU/UsdTror guld är på väg uppåt nu när bankerna har fått problem. Eller rättare sagt deras problem börjar komma fram i ljuset.
Indikator har korsat för nedgång men tror inte den nedgången blir så stor.
Så bevakar en trade enligt bild.

Guld Short möjlighet?Som ni ser så har guldet rusat på bra uppåt. Rsi befinner sig på över köpta nivåer samt candles som spikat rätt upp brukar sällan hålla. Jag tror att vi ser en rekyl nedåt ifrån gröna motstånds zonen. Skulle vi bryta oss ovanför har vi inte mycket motstånd kvar och nya ATH kan komma. Bevaka och var

XAUUSDGuld lyckades bryta motståndet från 1900 i går, vilket kan bana väg för fler framsteg, i väntan på dagens amerikanska KPI-data.
Som vi kan se på diagrammet, så länge som marknaden handlas över 1900, finns det en chans för fler framsteg för att testa 1925 års motstånd innan ytterligare en baissearta

Se alla ideér