Indikatorer, strategier och bibliotek
This script plots the Short Sale Restriction (SSR) Level relative to the previous day's closing price. It works on any time frame from 1 minute to daily, showing the correct level even during the extended session. The Short Sale Restriction (SSR) is a rule of the Securities and Exchange Commission (SEC) that restricts traders from short-selling stocks that are...
Visualize raw buying and selling pressure via 3 different calculation methods, all superimposed with dynamic rescaling. Buying and selling pressure is the concept of quantifying the disproportion between buying and selling. In practice, there is no single definitive way to calculate it. This indicator is a merge to display three different methods to calculate...
This is the Pressure Indicator. The Pressure Indicator analyzes a number of price ratios to measure the pressure of Buyers and Sellers. I’ve also added to the indicator: 1) Moving Averages (MA) – You can choose 3 types of MA: - Simple Moving Average (SMA) - Exponential Moving Average (EMA) - default - Volume Weighted Moving Average (VWMA) - Arnaud Legoux Moving...
Buying and selling pressure is a volatility indicator which denotes the balance between buyers and sellers inside candlestick. You set the length to average it just like ATR. But This offers further break down of participants of the market. Pretty much at any condition of the market the indicator can filter out interesting details to make trading decisions...
This indicator is based on volume and ma. This will help you to detect higher volume on chart. You can create alert to stay updated. I am using Fibonacci golden ratio to multiply the current volume. My logic is if volume comes greater than factor of Fibonacci number and current volume then consider it as a insider entry.
Hi, I have created Artharjan INDIA VIX v/s Nifty Volatility Dashboard to forecast the Annual, Quarterly, Monthly, Weekly, Daily and Hourly Volatility of NIFTY Benchmark Index based on current value of INDIA VIX. This will help Index Options Sellers to decide the range of Nifty for the given period based on current level of volatility indicated by INDIA...
Buying climax and Selling climax appear at the end of bullish and bearish market ..i trade them little bit different way .when price break buying and selling climax i look for trade sharing some example Breakout and test of buying climax high same with selling climax ..there can be various method to take trade A) trend continue method 1) when buying...
This strategy allows you to back test longing or shorting or do nothing during time increments of 30 minutes. The price trends in one direction every 30 minutes and this strategy allows you to test various 30 minute time frames across a range of dates to capitalize on this. Make sure you are in the 30 minute time frame while viewing the performance and trade history.
This indicator show a simple rolling cumulative volume. A field is specified. Then all last volume indicators are summed. For example it could calculate last 24h Volume if you use the 1h bars and set the length for 24.
This indicator looks simple but it was bit tricky to code and to make it work on all time frames . I have used array in this to showcase the use of array, array give you more flexibly. It works on all time frame 1m 2m 3m 5m 10m 15m 30m 60m 120m. When the time frame is greater than the or equal to "D" it will show the current bar volume only. Total volume is...
This script can be used to visually identify the 1 standard deviation range of price movement anticipated by NSE ticker for Volatility Index NSE:INDIAVIX Ideal to use on NSE:NIFTY ticker only! The NIFTY range is extended to Yearly, Monthly, Weekly, Daily based on the current value of INDIAVIX. All options are customizable: Time frame of the VIX Bands Select /...
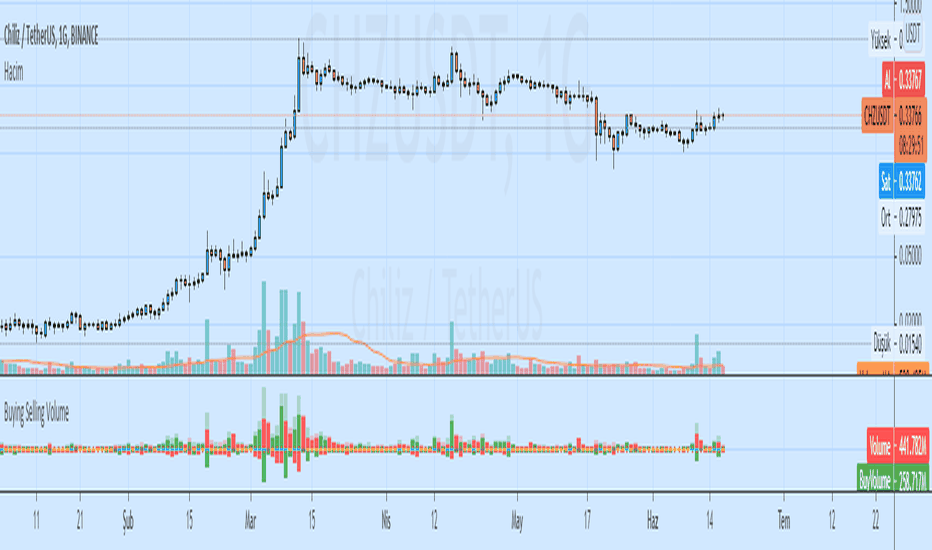
Buying Selling Volume -Buy Volume -Sell Volume -Buy Volume Percent % -Sell Volume Percent % -Volume Index -Buy Sell Volume- BuyVolume>SellVolume=Blue barcolor SellVolume>BuyVolume=Purple barcolor -Volume Index- VolumeIndex>length and close > open =Cyan barcolor VolumeIndex>length and close < open =Gray barcolor VolumeIndex<=length = Yellow barcolor
Buying and Selling Smoothed with Histogram Smoothed version with version with a red line representing the selling pressure and a green line which represents the Buying pressure. If the green line is above the red line it would mean that the Buying pressure is more and vice versa. The difference between the two is plotted as a Histogram. This is a cumulative...
Buying and Selling Pressure Raw Raw Buying and selling pressure Indicator. The Raw buying and selling indication is provided in terms of a Columns. Green bars above zero show the buying pressure and the red bars below the zero line show the selling pressure. This presents a good visual representation of the dominating pressure.
This script draws the short selling restriction level in the intraday chart
This indicator is an interpolation of the demand index by James Sibbet. Thomas Aspray, an experienced trader, suggests using DI in three formats, one of those was to plot the buying pressure (BP) and selling pressure (SP) as separate lines; which is what this indicator was designed to do. The green line represents the buying pressure and red line represents the...


