Marknadsupd V.48De ger jag mig in i en ny marknadsuppdatering, där jag kommer fortsätta enligt samma schema som förra gången. Börjar med en översiktlig marknadsuppdatering, sedan sektor uppdatering, analys av marknadsbredden sentimentet och en liten slutsats i hur jag kommer agera inför nästa vecka.
------------
Om S&P 500 Index
Standard and Poor's 500 Index är ett kapitaliseringsviktat börsindex som mäter resultatet för 500 stora börsnoterade företag i USA. Detta index täcker ett brett spektrum av branscher, inklusive teknik, hälsovård, energi och finans. Den fungerar som ett riktmärke för den amerikanska aktiemarknadens allmänna hälsa och som en återspegling av landets ekonomiska styrka.
Stora vinster i S&P 500 tolkas ofta som positiva signaler för ekonomin, medan förluster kan ses som tecken på potentiella problem. Investerare använder detta index som en barometer för sina egna portföljer och för att bedöma enskilda aktiers resultat. S&P 500-indexet spelar en viktig roll i finansvärlden och följs noga av analytiker och beslutsfattare.
Stora vinster i S&P 500 tolkas ofta som positiva signaler för ekonomin, medan förluster kan ses som tecken på potentiella problem. Investerare använder detta index som en barometer för sina egna portföljer och för att bedöma enskilda aktiers resultat. S&P 500-indexet spelar en viktig roll i finansvärlden och följs noga av analytiker och beslutsfattare.
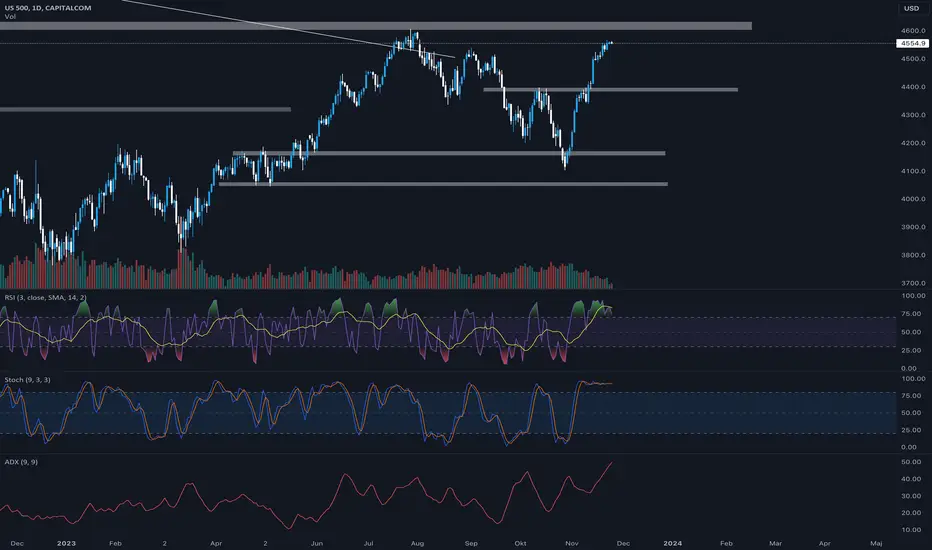
marknadsupd V.45Stark vecka, blev en bounce till slut. 5% på en vecka för NQ vilket är de vi har letat efter. Dock är frågan hur mycket högre det går i ett svep?
NQ börjar redan få väldigt höga nivåer i både RSI och Stoch, vilket om man kollar till dem tre senaste gångerna har satt highsen relativt pricksäkert. Io
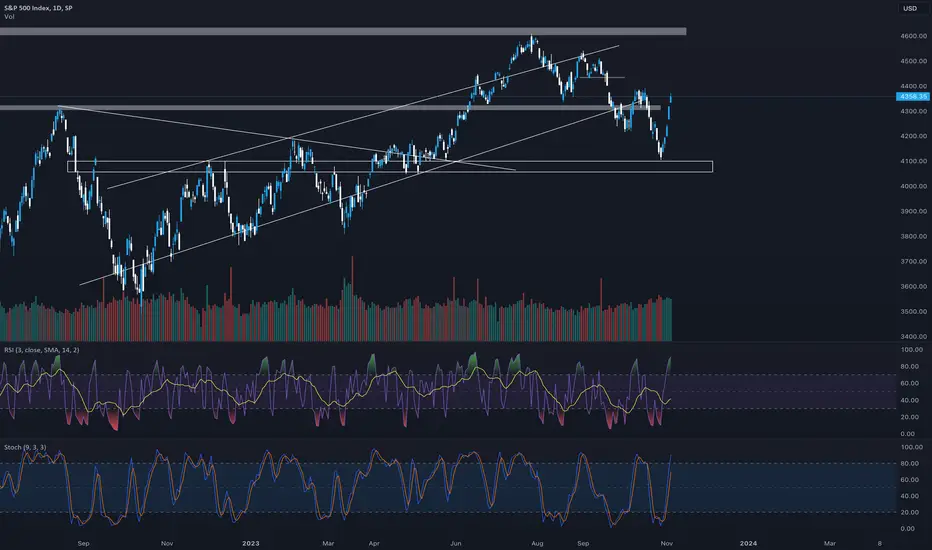
Marknadsupd v.44Då vare dags för en ny marknadsuppdatering. Mörknet har fallit över börtzen och allt är över kan jag konstatera. Ny lows och inget tecken på vändning, eller? Tänkte kika närmare på SPX, DXY, US10y och sentimentet i marknaden.
SPX
Efter en usel omvärlds situation och ett par taskiga rapporter från

Marknadsupd v.42Ojojojoj vad jag jinxade mig själv... gav förra veckan en väldigt bullig syn till marknaden och jag började skjuta hejvilt i breakouts. Visst vi har fått en uppgång på 2 % i index, men i helt fel sektorer för de första och för de andra blev det bara en översåld bounce.
De jag tar med mig från det

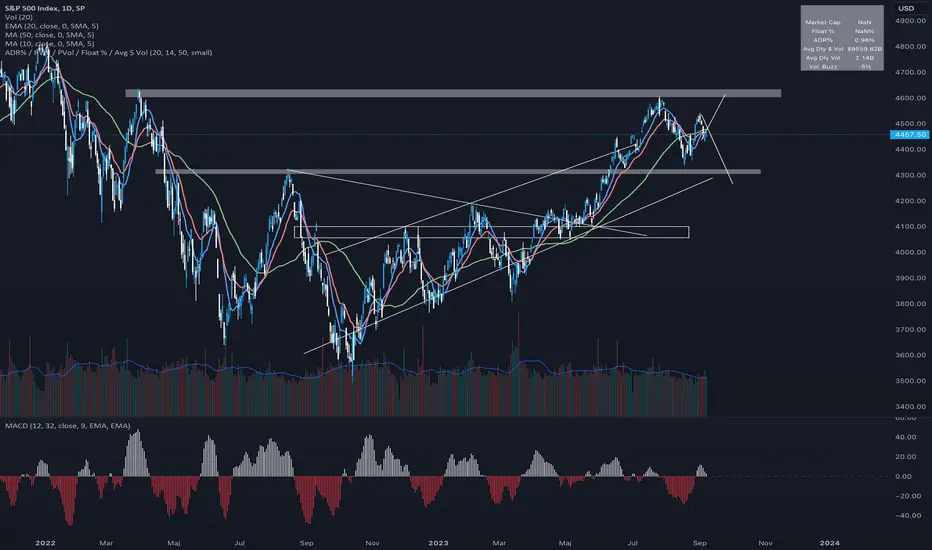
Marknads UPD v.41Ser ut att kunna bli ett bra slut på året! Kollar lite SPX till att börja med och detta gör jag för att SPX500 är ett index som ger en bred representation utav marknaden. Dock får man ta i beaktning är att indexet är marknadsviktat vilket innebär att storleken på bolagens viktning utgörs utav markna
Marknadsupdt v.40Dags för lite uppdatering igen!
SPX
Kollar lite snabbt på hur de ser ut här och kan väl påstå att det ser inte ljusare ut denna veckan för mina swings.
SPX bröt under en tisdagen 4330 ordentligt och gav inga tecken på återhämtning, dock kom det under onsdagen. Något som är väldigt negativt för mark
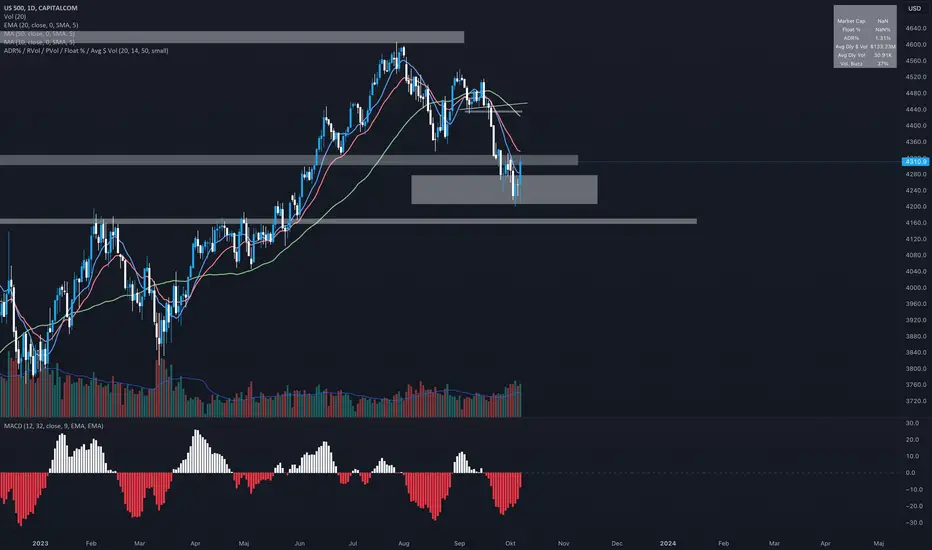
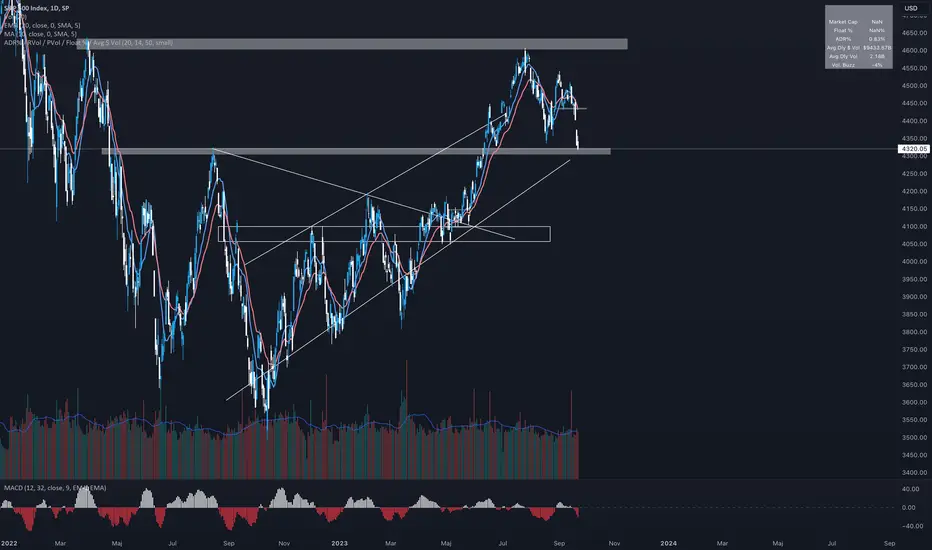
Marknadsupd. v.39Viktiga nivåer från förra veckan har samtliga blivit brutna! Ser ut att bjud på lite bäss framöver.
SPX:
Förra veckan pratade jag om inställningen till marknaden kommer bli värre om först 4430 bröts, nästa anhalt vart isåfall 4335. Nu har båda nivåerna brutits och läget ser inte jätte ljust ut!
Fö
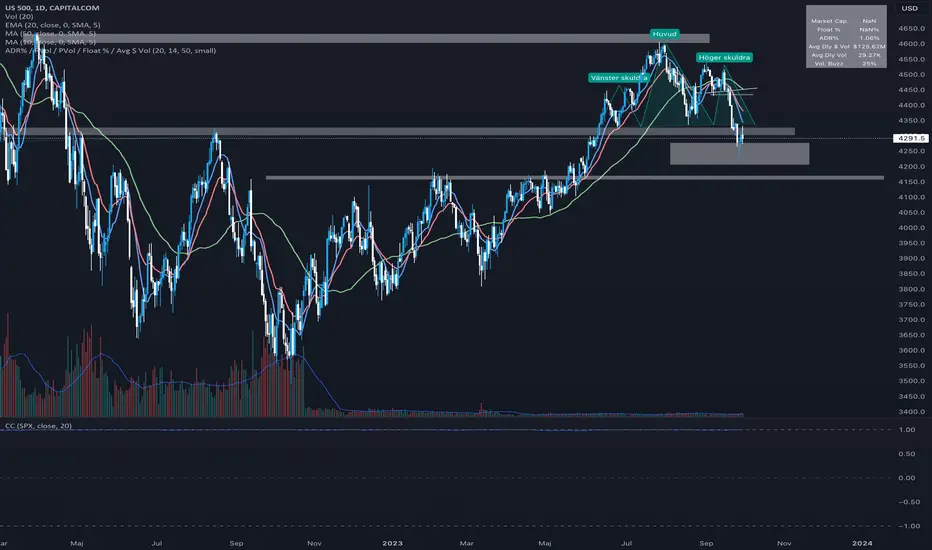
Marknadsupd v.37Tillbaka till SP500 och kollar lite snabbt på vart vi har markanden. Går sedan igenom mina bevakningslistor och uppdaterar de starkaste sektorerna.
SP500:
Rent spontat genom att bara stirra sig blint på grafen har vi nu brutit det viktiga området där vi satte den senaste highen och kommit tillbak
marknadsupd 27:e augDags för uppdatering igen. Var nästan två veckor sedan sist, mycket igång med flytt och annat smått å gott som tagit fokus under en seg marknadsperiod.
Börjar som vanligt med att kika på marknadsbredden och göra någon analys av hur marknaden kan se ut framåt.
För tillfället har SPX kommit ned ti

Marknadsupd 6 Augusti Då var de dags igen, Idag väntar en snabb genomgång utav SP500, nyheter kommande vecka, rapporter kommande vecka och uppdatering utav bevakningslistan. Idag uppdaterar jag enbart D och V screeningen.
Genomgång av SP500
Förra veckan fick vi något av ett risk off scenario där både dollar stiger och

Se alla ideér