Is there any chance for an ALTSEASON now??Just some chart fun. Do you think the pattern will be completed and the current altcoin Bull Cycle will follow the previous two? Do you think there will be a new Altseason amidst the tariff chaos?
Whatever happens, the 1W MA100 (green trend-line) has to hold (close 1W candles above it) if that would be the case and it just got breached.
-------------------------------------------------------------------------------
** Please LIKE 👍, FOLLOW ✅, SHARE 🙌 and COMMENT ✍ if you enjoy this idea! Also share your ideas and charts in the comments section below! This is best way to keep it relevant, support us, keep the content here free and allow the idea to reach as many people as possible. **
-------------------------------------------------------------------------------
💸💸💸💸💸💸
👇 👇 👇 👇 👇 👇
ALTS

FIFA WORLD CUP HISTORIC ROARING 20s QE Restart ScenarioBenjamin Cowen has been truly amazing with his analysis. As per monetary policy it's definitely too early to call the start of QE but we're on the right track.
it almost feels like the true Altseason will start when the FIFA World Cup starts. Every single scenario matches that theory. If you also pay attention to Algorand for instance, it's mimicking the early days of XRP. XRP is also mimicking the early years of Apple.
Can you imagine a scenario where XRP hits 120 dollars and Algorand 1200 dollars? I know I know the market caps etc. But so far it does feel like the markets are brewing for a truly historic roaring 20s scenario that could last for years.
Big question is, who has the first mover's advantage now and needs to catch up in the mean time?
I'm looking at tiny caps like Metastrike, and institutional coins like VeChain. China has already started QE so you may want to play around with VET while the entire market is boring.
JasmyCoin I can't tell yet, it could be but it has that annoying monitoring tag and in my case I've already survived 7 delistings already (dock, ooki, troy, gifto, gemie, kingdomverse, dreamsquest), so not touching it for now.
Looks very promising to be honest. Gotta have a long term vision here.

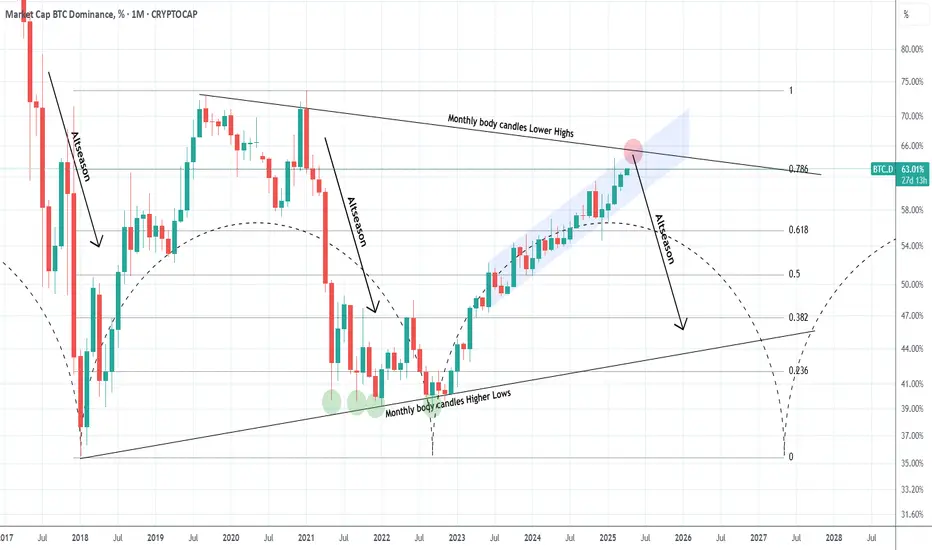
Is BTC Dominance about to reverse and start an Altseason?Well its undoubtedly what the crypto investor wants and what the market would have technically given in February if it wasn't for the tariffs trade war. Bitcoin's Dominance (BTC.D) is trading within a Triangle and February's test of the 0.786 Fibonacci retracement level was the technical level that should have given a rejection.
That rejection technically starts the Altseason which was dominant via a Bearish Leg both in 2017 and 2021. So far though both February's and March's 1M candles closed below the 0.786 Fib and April has an opportunity to even test the monthly body candles Lower Highs, which is the top of the Triangle. This is the last level that a rejection can be technically given.
Can this start an Altseason?
-------------------------------------------------------------------------------
** Please LIKE 👍, FOLLOW ✅, SHARE 🙌 and COMMENT ✍ if you enjoy this idea! Also share your ideas and charts in the comments section below! This is best way to keep it relevant, support us, keep the content here free and allow the idea to reach as many people as possible. **
-------------------------------------------------------------------------------
💸💸💸💸💸💸
👇 👇 👇 👇 👇 👇
TIA | PERFECT Bottom??In the macro, it's clear that TIA has been in a downward trend for an extended period of time. This means, it's a great place to buy - because the bullish cycle is up next.
Trend based indicators are great to identify the immediate predominant pressure on the chart, in this case, bearish. A "Buy" signal in the weekly timeframe would be the first step in the right direction (reversal).
Trend Based Indicator:
Another key indicator to watch is the daily timeframe, when the price begins to trade ABOVE the moving averages - that's when you'll have the first confirmation of a bullish turn around.
Moving Averages:
______________________
BINANCE:TIAUSDT

AAVE Trying To Bottom 🚨AAVE is looking beautiful 🚨, very interesting chart for more upside
and is now into support and trying to bottom
Do not miss out on AAVE as this is a great opportunity
Watch video for more details

ALTCOINS has already started the new parabolic rally.Altcoins (excluding top 10) are repeating the 2015-2017 market structure.
Based on the 1week RSI we are at levels similar to July 2017 when the market kickstarted the final parabolic rally of the Cycle.
We expect the market to reach the $1 Trillion market cap mark before the end of 2025 and peak the Cycle there.
Follow us, like the idea and leave a comment below!!

SNTUSDT Analysis: Avoid Getting Stuck in Mid-RangesI don’t want you to get lost in the mid-range areas . For SNTUSDT, I believe the blue box is a high-value demand zone . Given that overall market conditions are weak , I’ve identified a lower entry point that aligns with a safer and more strategic approach.
The blue box holds significance from multiple perspectives . I used heatmap , cumulative volume delta (CVD) , and volume footprint techniques to determine this precise demand region where buyers could potentially regain control.
Key Points:
Avoid Mid-Ranges: Focus on clear demand zones to avoid indecision.
Blue Box: A critical demand zone identified as a potential buyer area.
Techniques Used: Heatmap, CVD, and volume footprint for accuracy and precision.
If you'd like to learn how I use these tools to pinpoint such precise demand zones, just DM me!
If you think this analysis helps you, please don't forget to boost and comment on this. These motivate me to share more insights with you!
I keep my charts clean and simple because I believe clarity leads to better decisions.
My approach is built on years of experience and a solid track record. I don’t claim to know it all, but I’m confident in my ability to spot high-probability setups.
If you would like to learn how to use the heatmap, cumulative volume delta and volume footprint techniques that I use below to determine very accurate demand regions, you can send me a private message. I help anyone who wants it completely free of charge.
My Previous Analysis
🐶 DOGEUSDT.P: Next Move
🎨 RENDERUSDT.P: Opportunity of the Month
💎 ETHUSDT.P: Where to Retrace
🟢 BNBUSDT.P: Potential Surge
📊 BTC Dominance: Reaction Zone
🌊 WAVESUSDT.P: Demand Zone Potential
🟣 UNIUSDT.P: Long-Term Trade
🔵 XRPUSDT.P: Entry Zones
🔗 LINKUSDT.P: Follow The River
📈 BTCUSDT.P: Two Key Demand Zones
🟩 POLUSDT: Bullish Momentum
🌟 PENDLEUSDT.P: Where Opportunity Meets Precision
🔥 BTCUSDT.P: Liquidation of Highly Leveraged Longs
🌊 SOLUSDT.P: SOL's Dip - Your Opportunity
🐸 1000PEPEUSDT.P: Prime Bounce Zone Unlocked
🚀 ETHUSDT.P: Set to Explode - Don't Miss This Game Changer
🤖 IQUSDT: Smart Plan
⚡️ PONDUSDT: A Trade Not Taken Is Better Than a Losing One
💼 STMXUSDT: 2 Buying Areas
🐢 TURBOUSDT: Buy Zones and Buyer Presence
🌍 ICPUSDT.P: Massive Upside Potential | Check the Trade Update For Seeing Results
🟠 IDEXUSDT: Spot Buy Area | %26 Profit if You Trade with MSB
📌 USUALUSDT: Buyers Are Active + %70 Profit in Total
🌟 FORTHUSDT: Sniper Entry +%26 Reaction
🐳 QKCUSDT: Sniper Entry +%57 Reaction
I stopped adding to the list because it's kinda tiring to add 5-10 charts in every move but you can check my profile and see that it goes on..

Good r:r on alts.I have made market watch baded on indicator on main screen. It aggregate view on main alts. Fat dot is bullish. Thin coloured dot is signaling possible entry. Gray dot is bearish. No dot is just downtrend. Solid line is showing how market is performing. Now its valie is 1. In the recent past it was good place to enter long trades. Marked with yellow lines. Be aware. If this is entry into bear market there will be dead cat bouces so manage your risk.

XRP in BIG TROUBLE | BearishXRP is known as the "PUMP and DUMP" alt for a reason.
If you look at this chart from the macro timeframe, it clearly shows how XRP dumps hard after every parabolic increase - and this isn't even the entire price history..
The lower highs and lower lows we currently observe are not helping its case, either.
Pulling up the technical indicator in the weekly timeframe and we see a clear SELL - indicating that the price/trend has turned bearish.
And from what we know of XRP - it's likely that the price will drop ALL the way back to the lows, aka the beginning of the parabolic rally - possibly even further down.
______________________
BINANCE:XRPUSDT


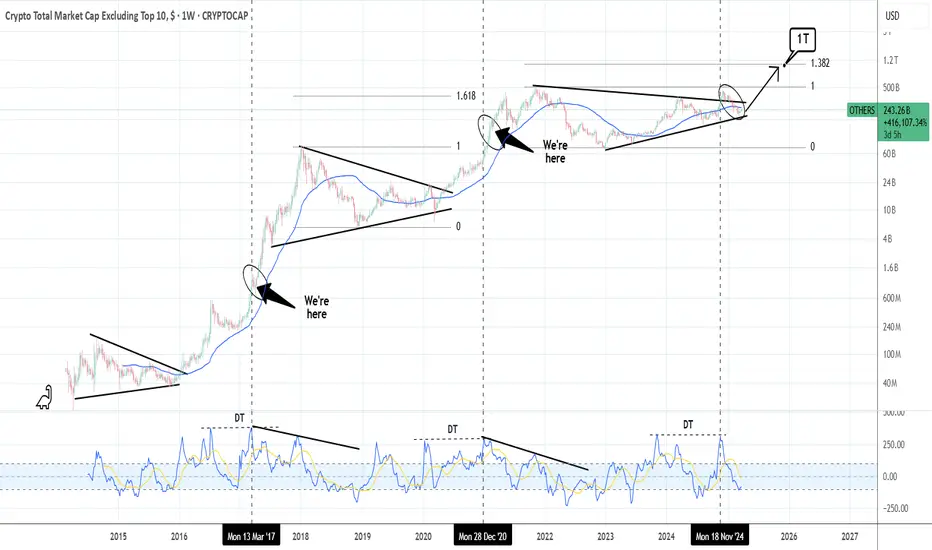
ALTSEASON: Is it really just around the corner?The Crypto Total Market Cap (excluding the Top 10) seems to agree. And it's simply because the price has already broken past the Cycle's Triangle and despite the correction, remains supported on the HL bottom trendline. According to the 1W CCI we are currently well in line with the previous two Cycles and even though the market is unlikely to reproduce the strong returns of especially the first Cycle, it does suggest that there is one last (All Time) High left. A mere 1.382 Fibonacci extension test, will give us the much sought 1 Trillion USD target.
## If you like our free content follow our profile to get more daily ideas. ##
## Comments and likes are greatly appreciated. ##

ALTSEASON 2025Dear investors and traders, members of the Horban Brothers community!
Today I come to you not with a warning of an impending crisis, but with the certainty that we are on the threshold of significant changes. The cryptocurrency market, which has been wavering in uncertainty for a long time, is finally entering a phase of active growth. Yes, you heard me right - from this moment, from today, we see all the signs that cryptocurrency is ready to take off.
All the data points to this: institutional investment in cryptocurrency is up 400% year-on-year, regulation is becoming clearer, leading to increased confidence among the big players, and most importantly, technological innovation in blockchain continues to convince even the most skeptical.
Make no mistake, the volatility of the cryptocurrency market will not go away, but those who are willing to accept these risks can expect rewards that are rarely seen in traditional markets. I'm not suggesting you rush out to buy everything, but carefully analyze those assets that show fundamental strength and technological resilience.
Now is not the time to be passive. Check your portfolios, reassess your strategies. If you're still standing on the sidelines of cryptocurrencies, now is the time to get in on the action. But remember, this is not for the faint of heart - this is a game for those who are willing to study, analyze and act.
This market, like any other, requires discipline and knowledge. Don't get caught up in emotions, don't fall for the hype, evaluate each project critically. But if you see that the project has potential, do not be afraid to invest.
Remember that cryptocurrencies are not just tokens; they are the foundation of the future financial world. And that world is already beginning to take shape.
Regards CFO Horban Brothers,
Alex Kostenich

Altcoins Can Explode In 2025 [READ CAREFULLY]Hello, Skyrexians!
It's time to update our CRYPTOCAP:OTHERS.D idea. In fact nothing changed still. We don't have the growth confirmation, but let's put together all facts which tell us that this growth can happen soon.
Let's take a look at the weekly time frame. We can see that Bullish/Bearish Reversal Bar Indicator gave us the green dot signal. This signal is unconfirmed. For confirmation we need breakout of 9% level. Much better if candle will be closed above it. This fact can finish the huge ABC correction which has been started after the previous altcoin season. This reversal bar has the great angle with alligator which is another one sign of soon trend change. All these signals can bring the dominance above 20%. In this case we will see massive gains on altcoins.
Best regards,
Skyrexio Team
___________________________________________________________
Please, boost this article and subscribe our page if you like analysis!

ACXUSDT – Resistance Zones Marked on the Chart!
“Key levels ahead—will resistance hold or will we see a breakout?”
🔥 Key Insights:
✅ Resistance Zones Clearly Defined – Watch for strong reactions.
✅ Rejection = Short Setup – Only with LTF breakdown + CDV confirmation.
💡 The Smart Plan:
Focus on LTF (15M & 1H) Price Action – Breakout or rejection will be clear there.
Use CDV & Volume Profile – Don’t trade blindly, follow the data.
Let the Market Show the Way – We react, not predict.
“Patience + Smart Entries = Winning Trades—watch the chart, trade the plan!” 📉
A tiny part of my runners:
🎯 ZENUSDT.P: Patience & Profitability | %230 Reaction from the Sniper Entry
🐶 DOGEUSDT.P: Next Move
🎨 RENDERUSDT.P: Opportunity of the Month
💎 ETHUSDT.P: Where to Retrace
🟢 BNBUSDT.P: Potential Surge
📊 BTC Dominance: Reaction Zone
🌊 WAVESUSDT.P: Demand Zone Potential
🟣 UNIUSDT.P: Long-Term Trade
🔵 XRPUSDT.P: Entry Zones
🔗 LINKUSDT.P: Follow The River
📈 BTCUSDT.P: Two Key Demand Zones
🟩 POLUSDT: Bullish Momentum
🌟 PENDLEUSDT.P: Where Opportunity Meets Precision
🔥 BTCUSDT.P: Liquidation of Highly Leveraged Longs
🌊 SOLUSDT.P: SOL's Dip - Your Opportunity
🐸 1000PEPEUSDT.P: Prime Bounce Zone Unlocked
🚀 ETHUSDT.P: Set to Explode - Don't Miss This Game Changer
🤖 IQUSDT: Smart Plan
⚡️ PONDUSDT: A Trade Not Taken Is Better Than a Losing One
💼 STMXUSDT: 2 Buying Areas
🐢 TURBOUSDT: Buy Zones and Buyer Presence
🌍 ICPUSDT.P: Massive Upside Potential | Check the Trade Update For Seeing Results
🟠 IDEXUSDT: Spot Buy Area | %26 Profit if You Trade with MSB
📌 USUALUSDT: Buyers Are Active + %70 Profit in Total
🌟 FORTHUSDT: Sniper Entry +%26 Reaction
🐳 QKCUSDT: Sniper Entry +%57 Reaction
📊 BTC.D: Retest of Key Area Highly Likely
I stopped adding to the list because it's kinda tiring to add 5-10 charts in every move but you can check my profile and see that it goes on..

ALTSEASON Party like 2021 is about to start.This is the unique ratio of the crypto total market cap excluding the top 10 against Bitcoin.
The market is consolidating for 7 straight weeks after rebounding on the top of the former Triangle of the previous Cycle.
Basically it this bearish leg is almost identical to October-December 2020. This kickstarted the Altseason of 2021.
We expect a similar altcoin rally to start as in 2021.
Follow us, like the idea and leave a comment below!!

TIAUSDT – Weak at Key Weekly Level! More Downside Ahead?TIAUSDT – Weak at Key Weekly Level! More Downside Ahead?
“This chart looks weak—momentum favors the downside. But is there a bounce first?”
🔥 Key Insights:
✅ Sitting at a Critical Weekly Zone – A breakdown here could be brutal.
✅ Momentum Looks Bearish – No real strength from buyers.
✅ Only Considering Low-Risk Buys – Fibonacci Green Zone (0-0.5) is the ideal cheap area.
💡 The Smart Plan:
Looking for a Break & Retest Downward – If support cracks, shorts become clear.
Small Risk Buys from the Fibonacci Zone – Only for aggressive traders.
CDV & Volume Profile Must Confirm – No buyers? No trade.
“Weak price action, heavy risk. Only the right levels matter here—watch closely!” 📉🔥⚠️
A tiny part of my runners;
🌊 WAVESUSDT.P: Demand Zone Potential
🟣 UNIUSDT.P: Long-Term Trade
🔵 XRPUSDT.P: Entry Zones
🔗 LINKUSDT.P: Follow The River
📈 BTCUSDT.P: Two Key Demand Zones

INJ | ALTCOINS | Bottom Likely CLOSEIn the previous cycle, INJ made a near full retracement after the bullish cycle.
This would put us round here, to which we are already fairly close:
To make it a little easier to reference, I'll use the Elliot wave tool (although these are not Elliot waves).
In short, the bottom is likely very close for INJ - but accumulation / sideways phase may take another while.
_______________________
BINANCE:INJUSDT

Alts- Will they drop further? (+name your alt)In my early February analysis on altcoins , I noted that while a bounce was likely after the sharp drop triggered by Trump’s initial tax remarks, the $1.3T level would act as strong resistance.
I expected another decline once this resistance was confirmed— which is exactly what happened, as the market reached that level and began to drop again.
After multiple tests of the rising trendline that began in October 2023, last week saw a breakdown, with price finding support just above $900B (an important level as we can see from the posted chart).
But was that the full extent of the drop?
In my view, we are far from being in the clear, and further declines seem likely. Technically, the rising trendline has been broken, and the recent rebound appears to be corrective rather than the start of a sustained recovery.
As long as the price remains below the $1.15T–$1.2T zone, I see a high probability of the market
breaking under 900B zone support and reaching $700B in the coming months.

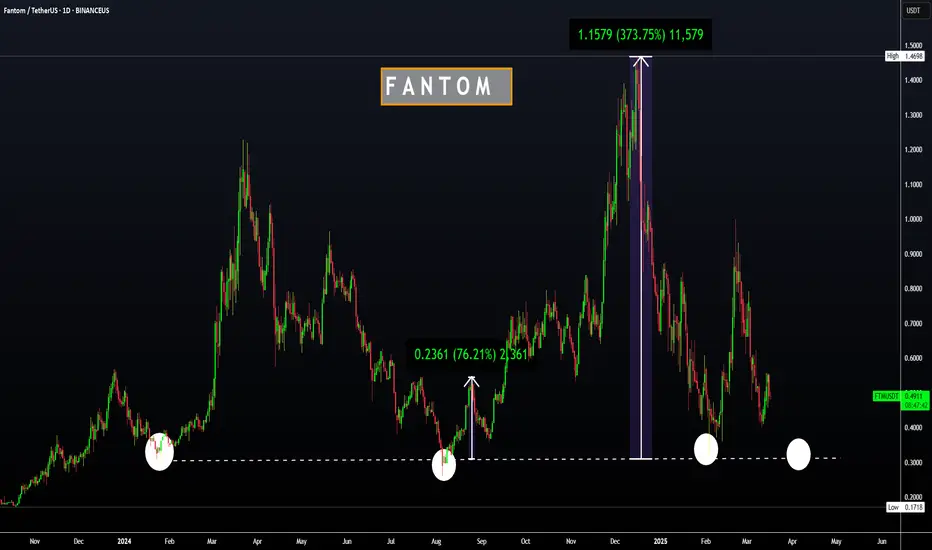
FTM | FANTOM | Altcoin with GREAT UPSIDE POTENTIALFTM has recently increased 11% in the weekly, but is making more red candles in the daily and the impulse up seems to be over for now.
Looking at the corrections, from -45% to -80% is not uncommon for Fantom.
The good news, is that the bottom is likely close - and from here, there exists great upside potential.
I am NOT saying we can't fall lower here - infact, a full retracement may be likely, just as we saw the previous cycle. In which case, the upside is even bigger. 30c is indeed a very popular demand zone:
_____________________
BINANCEUS:FTMUSDT
Potential Path of the Altcoin Market?Trading Family,
To say that our altcoin market has been disappointing would be the understatement of the year. While there definitely have been some winners (I have held Solana through the $8 low), the majority have been a large disappointment. In fact, the last I read, only 42 altcoins have outperformed Bitcoin since the bear market bottom was put in. This is an incredible stat to think about and very telling. Altcoin traders have a difficult task in beating the BTC hodl'ers for sure.
However, recently there have been some hidden indications that our altcoin market will soon increase our odds of success.
First of all, Bitcoin's low fees. Low fees on the Bitcoin blockchain is often a hidden health indicator for the coin signaling weak demand. People often see low fees as a positive thing. But what's actually happening here is that there is low demand for transacting on the chain, therefore, in order to increase the demand, transaction fees are forced down.
Weaker demand does seem to correlate with what the BTC dominance chart is showing us.
You can see from the chart that we have a large sell side liquidity block that has formed, indicating large sell side volume in dominance. Additionally, my indicator has flashed a red dot, signaling that it is time for dominance to drop. We also have our RSI and Macd, crossing down. And if we break from that channel, dominance drop momentum should accelerate.
This brings me to our TOTAL3 chart which is all altcoins excluding Ethereum. The chart is showing us that we have reached an extremely critical support trendline. Price is currently bouncing from it. Additionally, there are large volumes of buyers at this point. You can observe this by the VRVP candles and the liquidity blocks indicator. But contrary to BTC.D in which the RSI and Macd were crossing down, TOTAL3 shows our RSI and Macd crossing up! This is bullish for alts.
Finally, it is a great sign to see that our "M" pattern has looked to have completed right at our point of support.
I have drawn a projected pathway from here. In the first part of our next week, we may see a bit more pump. News of the passing continuing resolution here in the U.S. is still trickling out. Monday, as stock traders jump back in, I would imagine we see more pump as traders feel good about the averted gov't shutdown. This may trickle into Tuesday. But then Wed. is the Fed's day. We are expecting further pause to interest rate. Everyone will be listening to the Fed speak and parsing every syllable that is uttered from J. Pow's tongue. What is says and the bias that is interpreted will be key. I am expecting mostly a non-event here. Which means that bullish bias may wane once again. Crypto, mostly altcoins, really only pump on good news. But negative and even neutral news is a sell to sideways event. Thus, I expect we may hit another local top around Wed. afternoon at which point the altcoin market starts to sell a bit again OR it simply continues sideways again for a few more weeks. Sooner or later though, I believe we are headed towards that 1.3 trillion resistance. It is worthwhile considering to stay in a holding pattern unless we drop below our all-important support. Watch this line closely and draw it on your charts. It will be key!
✌️Stew

ALTS Brutal altseason is about to start.The altcoin market cap just hit its 1week MA200, right at the bottom of the 2.5 year Channel Up.
This has completed a -57.89% decline from the most recent High, the same decline percentage as the ones that formed the August 5th 2024 and December 26th 2022 bottoms.
The 1week RSI has also almost hit its 2 year Support.
If bullish waves are as symmetric as bearish waves, we can expect at least a rapid rise / ALTSEASON to 575 B (+199.05%).
If the market structure follows the June 2023 - March 2024 bullish wave, we can expect a more brutal rally to the 2.0 Fibonacci extension at 865 B.
Follow us, like the idea and leave a comment below!!

ONDO | ALTS | Lower Price LikelyONDO could be a good hold, if a lower entry presents itself.
It's worrisome that the opening prices have not yet been retested, and the next immediate support zone is approaching fast:
I'd be willing to start accumulating from anywhere under the next immediate support zone.
____________________________
BYBIT:ONDOUSDT

TonCoin- Eliminate the useless, keep the essential.
- imo Toncoin looks bottomed, but remember, crypto moves fast, if BTC dips, altcoins usually follow harder.
- That said, for now, I don’t see altcoins dropping further; they sound to be not far from a rock bottom.
------------------------------------------------------------------
Simple Trade Strategy :
------------------------------------------------------------------
- Buy now around 3$
- Keep some juice to DCA more around 2.30$
------------------------------------------------------------------
TP : 5.50$
SL : 1.95$
------------------------------------------------------------------
Play Wisely !
Happy Tr4Ding !
