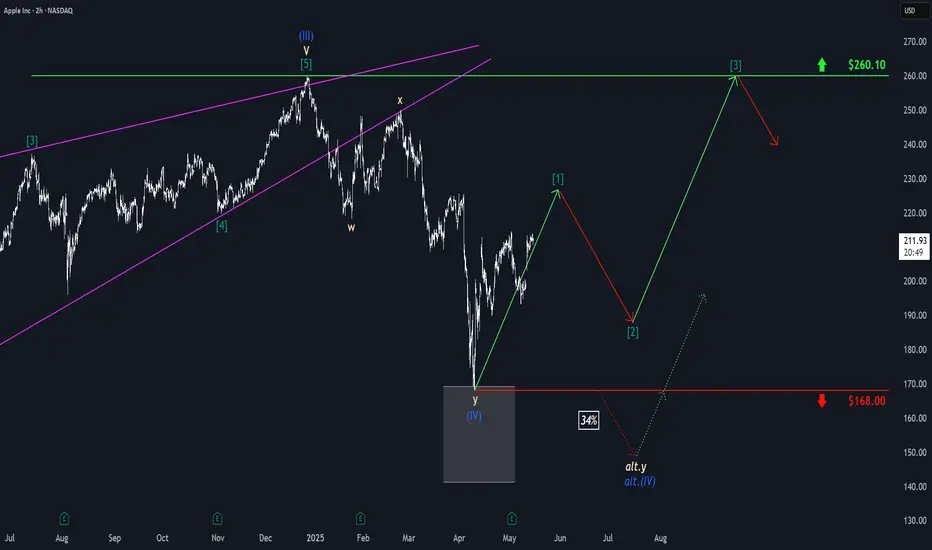
Apple: Wave [1] IntactDespite a significant setback, Apple managed to gather new momentum on the upside and continue its work on the green wave . The impulse structure remains intact, and we expect a new high imminently before the next countermovement with wave follows. The stock should not breach the support at $168 to enable wave to initiate the next upward phase. If the price does fall below the $168 mark, our 34% likely alternative scenario will allow for a new low of wave alt.(IV) in blue, though the rise would also continue after this lower low.
Chartanalysis
$SMCI decent looking setup, small bull flag zoomed dailyI'm looking to swing some $34 or $35c 2 weeks out. The volume pattern seems to be more accumulating rather than selling even after an abysmal and confusing earnings. This name loves to pump 7%, 9%, 10%.

$U $20 support, flagging in ascension Interesting setup here. Looks pretty good IMO. Software is a great name to look at in this market environment. It has a nice support at $20, even at large volume here it’s holding nicely so it shows relative strength. This name is definitely bullish long term. I’m in $21.5c for 2 weeks out, this is a high IV% name. Can run 10% in a day, 20% in a week, etc. We will see how it plays out.
WSL.

Japan Pushes Back on Auto TariffsThe Japanese Yen strengthened to around 146 per dollar, marking its third straight gain as global trade concerns weighed on the U.S. Dollar. Asian currencies broadly rose with speculation that the U.S. may be favoring a weaker Dollar to aid trade talks. Trump’s administration argues that undervalued Asian currencies create unfair competition for American exporters.
Meanwhile, Japan continues U.S. trade negotiations, with PM Shigeru Ishiba pushing for a deal that includes the auto sector and the removal of the 25% car tariff.
USD/JPY faces resistance at 148.60, with further levels at 149.80 and 151.20. Major support is seen at 139.70, then 137.00, and 135.00.

Solana: Below ResistanceOur primary scenario for Solana is that the coin is already close to the top of the green wave 4. Therefore, we expect a bearish trend reversal below the resistance at $192.33, followed by a move toward our blue Target Zone (coordinates: $56.56 – $29.87) with the green wave 5. Down there, we see an opportunity for long trades with the low of the blue wave (ii), which should be followed by a fresh upward impulse. According to our alternative scenario (probability: 38%), however, we may have already seen the low with wave alt.(ii) in blue prematurely. To validate this alternative scenario, the price would have to rise directly above the resistance at $192.33 from here and extend the blue wave alt.(iii) .

Pound Gains on Strong UK GDPThe British pound climbed to $1.3320 on Friday after strong UK GDP data showed the economy grew 0.7% in Q1 and 1.3% year-over-year, easing pressure on the Bank of England to cut rates aggressively. While a cut is still likely, the solid growth figures suggest urgency has diminished. At the same time, a softer U.S. dollar, driven by speculation that the U.S. may be allowing depreciation to support exports, has supported sterling. However, the UK’s broader outlook remains mixed, with rising unemployment and slowing wage growth signaling uneven momentum.
GBP/USD faces resistance at 1.3350, with additional levels at 1.3450 and 1.3550. Support levels are at 1.3160, 1.3000, and 1.2960.

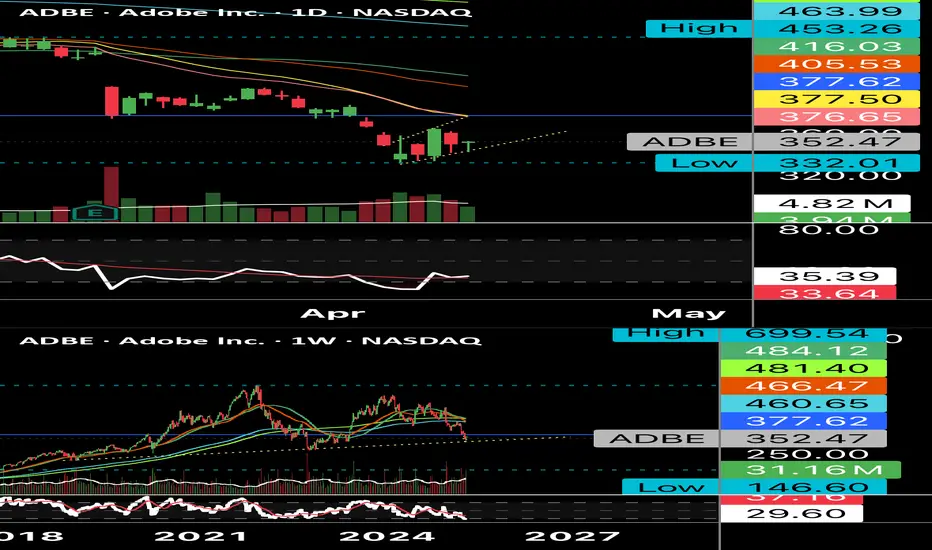
$ADBE $380 Hammer CandleLittle hammer candle on some nicely oversold conditions with my moving average just below the RSI on the Daily. I like this for a $380 test. With a break through you could see $405-$408. Eyeing $380 calls a week or two out.
WSL
Decantraland: Progress in wave [i]Following the renewed rise last week, we continue to locate the MANA coin at the beginning of the magenta wave . This movement should have the medium- to short-term potential to extend above the resistance levels at $0.59 and $0.85 before a countermovement should pick up again with wave . Nevertheless, there is a 33% chance for our alternative scenario: if weakness emerges in the near future, a new low of the green wave alt. might be reached. Ultimately, however, this would only imply a slight delay.

Risk Appetite Weighs on GoldGold hovers near $3,155, attempting to stabilize after falling more than 2% the previous day. The metal trades below $3,200, pressured by improved risk appetite following U.S.-China tariff reductions and upcoming U.S. data releases, including PPI and Retail Sales.
Fed Chair Powell’s speech is also in focus, as markets seek clues on interest rate policy. While the weaker Dollar has lent gold some support, traders remain cautious ahead of potential rate-cut signals.
Key resistance is seen at $3,235, followed by $3,300 and $3,350. On the downside, support begins at $3,120, then $3,030 and $2,956.

"Bearish Reversal Setup with Target at Key Support Zone (95,440 1. EMA Indicators:
50 EMA (red line): Currently at 103,112.73.
200 EMA (blue line): Currently at 98,739.46.
The price is above both EMAs, typically a bullish sign, but the analysis suggests a potential reversal.
2. Support Zone (Top Pink Box):
Around the 105,000–106,000 USD range.
Labeled as "support" but is likely being interpreted as a resistance now due to failure to break higher.
3. Target Zone (Bottom Pink Box):
Around the 95,000–96,000 USD range.
Marked as the "target point" for a potential drop.
4. Bearish Projection:
A curved arrow suggests a rejection from the current levels (~104,000 USD) leading down toward the target zone.
Large blue arrow emphasizes expected bearish momentum.
Interpretation:
The chart suggests a reversal from the recent highs and expects a decline toward the 95,440.94 USD support.
This could be driven by:
Rejection from resistance.
Overbought conditions.
Price losing momentum near the upper level.
Confirmation may be awaited via a break below the 50 EMA or loss of key support.
Strategy Implication:
Short bias if price fails to reclaim the resistance.
Take profit potentially near the 95,440 level.
Invalidation of the bearish scenario may occur on a strong breakout above the resistance zone (~105,700 USD).

PayPal: Upward PressurePYPL has remained under upward pressure, moving significantly closer to the important resistance at $78.86. If the price rises above this level directly, we will have to assume that it has already completed the beige wave alt.II —and thus the overarching corrective movement—with the last notable low. Consequently, in this 45% probable case, the stock would have already entered a new upward cycle, specifically the first wave alt.1 of a turquoise upward impulse. Primarily, however, we expect the stock to imminently reverse downward to complete the regular wave II below the support at $50.18. Only afterward should a new sustainable upward impulse begin—initially driving rises above $94.97.

Gold Holds Key Support Ahead of CPI Data📊 Technical Overview
1. Key Levels
Support Zone: ~$3,224 to ~$3,236 (highlighted yellow box) — price has bounced here multiple times (green arrows), indicating strong demand.
Resistance Zone: ~$3,420 to ~$3,440 — where price previously reversed (upper yellow box).
CPI News Target: ~$3,348 — identified as a potential bullish target on CPI-related momentum.
2. EMAs
50 EMA (Red): ~$3,299 – currently above price, acting as dynamic resistance.
200 EMA (Blue): ~$3,224 – at the lower edge of support, reinforcing the critical support zone.
3. Price Action
Strong bounce from support shows bullish reaction.
There is a potential double bottom or accumulation pattern forming at support.
The bullish target is around $3,348 (CPI news reaction zone).
🧠 Trading Idea
✅ Bullish Scenario
Entry: Near current price ($3,236), ideally on confirmation of support holding.
Target: $3,348 (CPI news target zone).
Stop Loss: Below $3,224 (below the 200 EMA and last swing low).
Risk/Reward: Favorable if the bounce is strong and momentum builds with upcoming U.S. news (likely CPI data).
❌ Bearish Scenario
If price closes below $3,224, especially on strong volume, it may signal a breakdown.
Watch for a retest and failure of support-turned-resistance for short entries.
🔔 News Catalyst
U.S. CPI data (highlighted) on the calendar — this is likely to inject volatility. A hot CPI could strengthen USD and pressure gold, while a cool CPI could lift gold prices sharply toward the $3,348 target.
📌 Summary
Bias: Short-term bullish above $3,224.
Key Levels: Support ($3,224–$3,236), Resistance ($3,348, then $3,420–$3,440).
Strategy: Buy dips near support, watch CPI news for breakout potential.

Momentum Rising – $XRP Bulls Eyeing Next Leg UpCRYPTOCAP:XRP is waking up 🔥
Price has broken out of the long-term downtrend and is now testing the important horizontal resistance area
A clean break above this range might spark the next big move. Volume is on the increase, and the structure is all good
Time to keep an eye on this one 👀

eBay: Resistance Touched!EBAY has managed to fight its way upward as expected, reaching the resistance at $71.51. In the course of the ongoing (corrective) upward movement, the price has now touched this mark for the third time – and once again showed a pullback reaction. Primarily, the stock should rise above the $71.51 level in the next step to complete the beige wave b above it. However, there remains a 27% chance for a new interim low of the magenta wave alt.(X). In this case, the stock would take a detour below the support at $55.96 but would turn upward again above the lower $49.63 mark.


BTC at Critical Inflection Zone: Breakout or Pullback🔍 Technical Analysis Overview
1. Current Price Action
Current Price: ~$104,129
BTC is trading within a key resistance-turned-support zone (around 104,000–104,900).
Price has been consolidating near the upper boundary, indicating indecision or preparation for a breakout.
2. Support/Resistance Zones
Resistance (now support): 104,000–104,900
Target 1 (downside): ~96,969 (near previous resistance + EMA 50 level)
Target 2 (upside): ~109,525 (projected move if breakout occurs)
3. EMA Levels
EMA 50: 100,446 – Could act as dynamic support in a pullback.
EMA 200: 93,676 – Stronger trend support, much lower.
4. Price Structure & Pattern
A potential ascending triangle or range formation at resistance is visible.
The red arrow suggests a possible short trigger on rejection from the top of the zone.
If price breaks down from the support (around 104,000), a bearish move toward 100,000–97,000 may occur.
📈 Scenario Outlooks
🔵 Bullish Scenario
A confirmed breakout above 104,900 (Break Sell Zone) may lead to:
Continuation toward 109,525
Needs volume confirmation and candle close above resistance
🔴 Bearish Scenario
Rejection at current resistance and break below 104,000 support could trigger:
Drop to Target 1 (96,969), supported by the 50 EMA
Possible bounce around 100,284 minor support first
✅ Summary
Key Decision Zone: 104,000–104,900
Watch for breakout or breakdown confirmation
EMA 50 & previous resistance at 100,000 area could act as interim support
Trend remains bullish unless the price decisively breaks below the 50 EMA

Breakout in Dave Inc...Chart is self explanatory. Levels of breakout, possible up-moves (where stock may find resistances) and support (close below which, setup will be invalidated) are clearly defined.
Disclaimer: This is for demonstration and educational purpose only. This is not buying or selling recommendations. Please consult your financial advisor before taking any trade.

USD/JPY Reversal or Breakdown at Key Support ZoneCANDLE MASTER Update!
Here's a breakdown of the analysis idea shown:
Key Elements:
Support Zone (142.40–142.70 area): Price is currently testing this area. It acted as support in the past and may again lead to a bullish bounce.
Resistance Zone (145.00–146.00 area): Marked as a strong resistance area, near the 200 EMA. This would be a potential target if the support holds.
Next Support Zone (around 140.00–140.50): If the current support fails, price could move toward this lower support level.
Moving Averages:
50 EMA (red): Currently above the price, acting as dynamic resistance.
200 EMA (blue): Also above the price, adding confluence to the resistance zone.
Potential Trade Scenarios:
1. Bullish Reversal:
Price holds at current support.
A bounce occurs, and price targets the resistance zone near 145.90.
Entry could be confirmed with bullish candlestick patterns or a break above a local high.
2. Bearish Breakdown:
Price breaks below the current support zone.
Next support target would be around 140.52.
Entry could be considered after a retest of the broken support as resistance.
This is a classical support/resistance setup with confluence from EMAs and price action zones.

BTC Rebounds from Support, Eyes Resistance ZoneBitcoin Price Analysis – Potential Upside from Support Zone
The chart shows Bitcoin (BTC/USD) trading in a range between strong support ($98,500–$99,000). After bouncing from support, price is currently testing the 50 EMA (~$94,821). A bullish scenario is expected with a possible move toward the resistance zone if price holds above support.

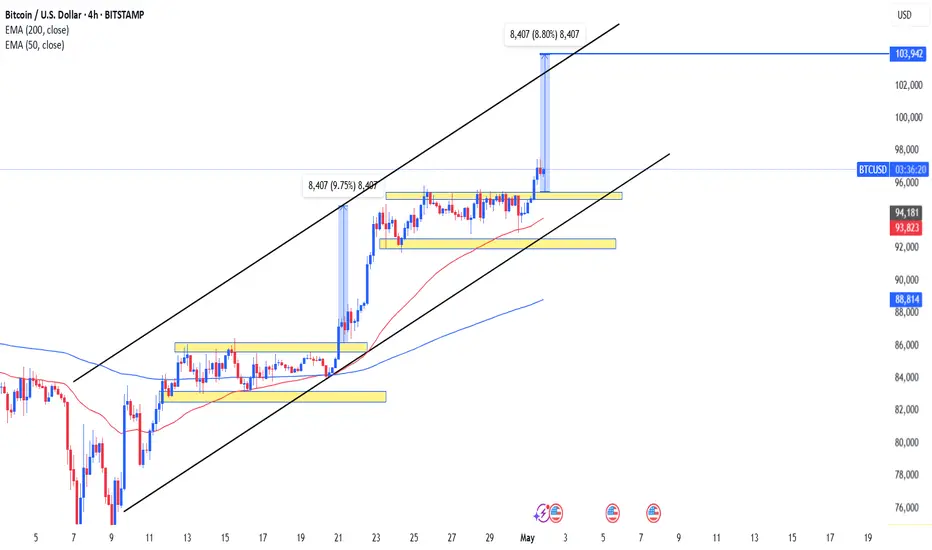
"Bitcoin Breakout Within Ascending Channel Targets $103,942"CANDLE MASTER Update!
Bitcoin (BTC/USD) showing a bullish market structure with a clear ascending channel and breakout pattern. Here's a detailed analysis:
Key Observations:
1. Ascending Channel:
The price is moving within an ascending channel (black lines), showing a bullish trend.
Bitcoin has recently broken out above a consolidation range, continuing the bullish momentum.
2. Support Zones (Yellow Boxes):
Multiple horizontal support zones have been marked where price previously consolidated before breaking out.
These zones could act as support if there's a retracement.
3. Breakout Projection:
The breakout move is highlighted with a vertical measurement of 8,407 points, or approximately 8.80%.
This same measurement has been projected upward from the recent breakout, targeting around $103,942, which is the next price objective.
4. Moving Averages:
50 EMA (red) and 200 EMA (blue) are both trending upwards, which supports the bullish trend.
Price is trading well above both EMAs, indicating strong bullish momentum.
5. Volume/Timing:
No volume is shown, but the structure suggests accumulation phases followed by sharp upward moves — classic signs of breakout trading behavior.
Conclusion:
Bitcoin appears to be in a strong bullish trend with momentum likely continuing toward the $103,942 level as per the breakout projection. Support is well defined below, and unless price breaks below the lower trendline or major EMAs, the bullish outlook remains intact.
Gold 8H – Probable Scenario Until the End of May 2025Briefly today!
Greetings, let’s take a look at the current situation for gold.
Technically, we can see a classic symmetrical triangle forming on the 8-hour chart, with a support zone established in the 3291–3300 range.
I'm expecting a move towards the 3440–3450 area, followed by a retest and an upward push toward the 3833 level.
Fundamentally, we take into account Trump's policy stance and the ongoing conflict between Pakistan and India.

$BNB Surprised $678 Price Mega Big pumping & Touch to $700+ ✨ CRYPTOCAP:BNB Surprised $678 Price Mega Big pumping & Trying to $700+ Milestone again.
💫 From Breaking News:
• BNB Eyes $700 as CZ Pushes 90% Binance Chain Fee Cut
•Bhutan Partners with Binance Pay and DK Bank to Launch the World’s First National Crypto-Based Tourism Payment System
BNB price surged over 10%, hitting $642.92 after CZ’s 90% BSC gas fee cut proposal.
RSI reached 78.42, confirming strong bullish momentum and overbought conditions.
BNB may test $700 if Binance validators approve the proposed BEP-336 transaction model.
On May 9, Binance Coin (BNB) climbed to $642.92, rising over 10% in 24 hours. The price rally followed a proposal from Binance founder Changpeng Zhao (CZ) to cut gas fees on Binance Smart Chain (BSC) by 90%.
#Write2Earn #bnb #BinanceSquareFamily #MarketRebound #SUBROOFFICIAL
Disclaimer: This article is for informational purposes only and does not constitute financial advice. Always conduct your own research before making any investment decisions. Digital asset prices are subject to high market risk and price volatility. The value of your investment may go down or up, and you may not get back the amount invested.

$ETH Surprised $2.4K Price Mega Big pumping & touch to $3K ✨ CRYPTOCAP:ETH Surprised $2.4K Price Mega Big pumping & Trying to $3K Milestone again.
💫 From Breaking News:
• Ethereum Foundation Invests $32.65M in Ecosystem Growth
• Ethereum To Expand Network Capacity with Gas Limit Increase
Ethereum blockchain is preparing for a major upgrade that could make its network faster, cheaper, and more efficient. Developers have proposed raising the gas limit by 66% in a new development, from 36 million to 60 million units.
This change aims to improve the number of transactions the network can handle per block. This is to help users and developers enjoy smoother and more affordable activity on the blockchain.
Developer Says Testing Success Leads to Mainnet Rollout
Ethereum core developer Parithosh Jayanthi recently confirmed that the upgrade had passed early tests and is now ready for broader use. The new gas limit was successfully tested on the Sepolia and Holesky testnets. According to Jayanthi, the final rollout to Ethereum’s mainnet will begin shortly.
This is the second time Ethereum has raised its gas limit in 2025. The first increase happened in February, when the limit increased from 30 million to 36 million. These changes came after there hadn’t been any gas increase on the network since 2021.
#Write2Earn #ETH #BinanceSquareFamily #MarketRebound #SUBROOFFICIAL
Disclaimer: This article is for informational purposes only and does not constitute financial advice. Always conduct your own research before making any investment decisions. Digital asset prices are subject to high market risk and price volatility. The value of your investment may go down or up, and you may not get back the amount invested.
