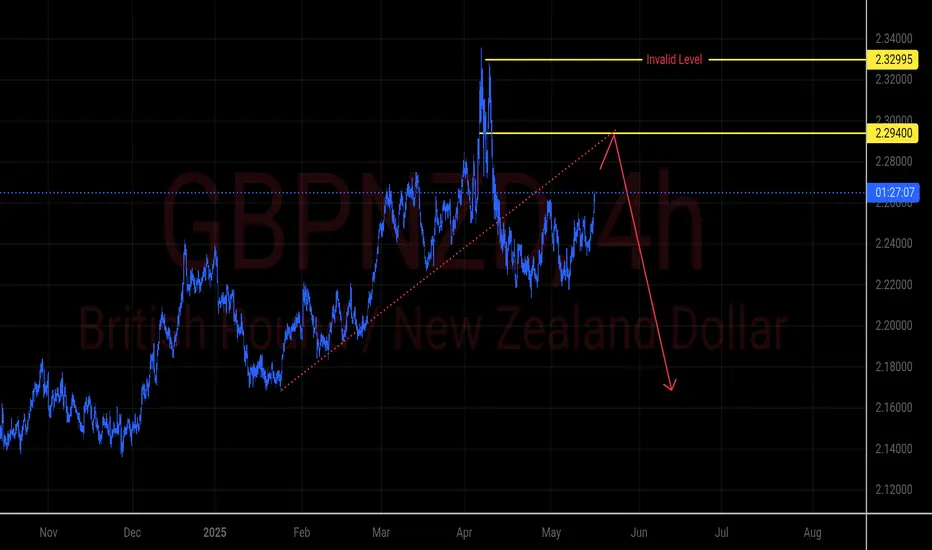
GBPNZD Potential Bearish Reversal After Trendline Break
Market Structure: Price recently formed a lower high and broke below an ascending trendline, signaling potential bearish momentum.
Key Resistance Levels:
2.29400 – Major structure zone, likely to act as resistance.
2.32995 – Invalidation Level – if price breaks and holds above this level, the bearish bias is no longer valid.
Trade Idea:
Watching for a pullback toward 2.29400 followed by bearish confirmation to short the pair.
Targeting downside movement toward the 2.18000–2.16000 area.
Bias: Bearish
Confirmation Needed: Rejection at resistance and bearish candlestick pattern.
---
Disclaimer: This analysis is for educational purposes only and does not constitute financial advice. Always do your own research before making any trading decisions.
Chart Patterns
Gold Update – Bearish Structure Intact, 3165 in SightIn my Monday analysis, I mentioned the possibility of Gold retesting the 3200 zone, and that scenario played out as expected.
After breaking back below the 3270 support, price accelerated to the downside, reaching a low around 3208.
A rebound followed, with XAUUSD retesting the 3270 zone, which now acts as resistance after the breakdown.
Looking ahead, I expect a break below the 3200 level, with the next bearish target set around the 3165 support zone.
The plan remains unchanged:
As long as Gold stays below 3270, I’m looking to sell rallies into that resistance area. 🚀
Disclosure: I am part of Trade Nation's Influencer program and receive a monthly fee for using their TradingView charts in my analyses and educational articles.

Gold XAUUSD Possible Move 15.05.2025Key Supply Zones to Watch for Short Opportunities:
3170–3175 Zone:
→ Strong supply area.
→ If price rejects this zone with confirmation (e.g., bearish engulfing, M5/M15 BOS or CHoCH), enter sell.
3150–3155 Zone:
→ Mid-level supply.
→ If price fails to reach 3170 and breaks below this level, wait for a break & retest of this zone for potential sell entries.
📉 Trade Signal (Sell Bias):
Scenario 1 – Rejection at 3170–3175:
Sell Entry: On confirmation at 3170–3175
SL: Above 3178
TP1: 3155
TP2: 3145
TP3: 3125 (final target – next demand zone)
Scenario 2 – Break of 3150–3155:
Sell Entry: On retest of 3150–3155 zone after breakdown
SL: Above 3160
TP1: 3135
TP2: 3125
✅ Confirmation Tools:
Candlestick pattern (e.g., bearish engulfing / M15 BOS)
Lower timeframe structure shift (M5-M15 CHoCH)
Volume spike or momentum fade at zone
Kindly follow, comment, like and share.

SEI/USDT Daily Chart Analysis – Potential Reversal ConfirmedThe SEI/USDT chart on the daily timeframe presents a notable Inverse Head and Shoulders (IH&S) pattern, which appears to have completed successfully. The neckline breakout occurred with a strong bullish impulse, suggesting a potential trend reversal from the prior downtrend.
Following the breakout, price encountered a significant resistance zone between $0.275 - $0.295, which acted as a supply area and triggered a short-term pullback. This level aligns with a previous structural breakdown point, adding to its validity as a resistance.
A key demand zone (highlighted in green), located between $0.195 - $0.229, has been marked as the “Long Idea” zone. This area previously served as resistance and now has the potential to flip into strong support upon retest, offering a favorable long entry if price revisits the zone. The current price action suggests that this retest may occur, offering an opportunity to enter with a better risk/reward ratio.
The measured move target from the IH&S pattern points towards the $0.35 region, which also coincides with a major horizontal resistance zone and serves as the primary take profit (TP) target.

SYSTEM SIGNAL: IOTA SHORT12/05/2025 IOTA Short
It's time to correct! Even though the bias and momentum are strongly to the upside, I believe there's a good chance for this short! Fireee! 🔥
ENTRY: 0.2491
STOP: 0.7922
TP1 -> RR1.5: 0.2216 -> 67% probability
TP2 -> RR2: 0.2124 -> 33% probability
TP3 -> RR3: 0.1940-> 17% probability
BIAS: Long-> half size


EURNZD – 1H Bullish Divergence - Bullish SetupEURNZD – 1H Bullish Divergence | Reversal Setup Brewing 🔄📈
Hey traders 👋
We’re spotting a clean bullish divergence on EURNZD’s 1H timeframe — and it’s developing right at a potential turning point. If you're hunting for a sharp intraday reversal, this setup deserves your attention.
🔍 Technical Breakdown
Price action: Making lower lows
Momentum indicators (RSI / MACD): Printing higher lows
That’s your bullish divergence, loud and clear — signaling that although price is falling, the momentum behind the drop is fading fast.
This kind of divergence often appears before a sharp bounce or a trend shift — especially on the 1H.
⚡ Confluence (What Makes This Setup Stronger)
Divergence forming at a local support zone
Multiple rejections at the low – showing buyer interest
Price slowing down — candles getting tighter = potential squeeze before expansion
🎯 Trade Plan
Aggressive Entry: Off the divergence low, using candle confirmation
Conservative Entry: Wait for a break of minor structure high or trendline
Stop Loss: Below the swing low
Targets: Prior resistance zones or fib retracement levels (38.2% / 61.8%)
This is not about guessing direction — it’s about reading the shift in momentum before price reacts.
📌 EURNZD Bullish Divergence on 1H – Is the Trend About to Turn?
What’s your entry game here — early off the divergence or waiting for a clean breakout?
#EURNZD #ForexTrading #BullishDivergence #PriceAction #TechnicalSetup #1HChart #ReversalPlay #SmartMoney #MomentumShift #FXIdeas

NZDUSD Sell Trade Plan (NZDUSD)Price has move below the 200MA indicating the trend os down. The market has also signalled that we are now bearish and now we are looking for an entry short.
We have a level of resistance as a POI. Keeping eyes on price action on the 15m / 5m charts to scalp an entry.

USDCAD Is Bullish! Long!The USD/CAD exchange rate consolidated near 1.3980 during the European trading session, after the Canadian dollar (CAD) came under pressure due to falling crude oil prices, enabling the pair to recover earlier losses. Given that Canada is the largest crude oil exporter to the U.S., declining oil prices typically dampen CAD sentiment.
USD/CAD is displaying a complex technical trend. On the daily chart, the price is currently consolidating around the 1.3980 level. The pair has rebounded from a recent low of 1.3749 and is now attempting to break through the key psychological barrier of 1.4000. If it can surpass both the 1.4000 psychological level and the 1.4050 resistance, further upside toward 1.4150 could be possible. On the downside, key support lies at 1.3890 (the lower edge of the recent consolidation range) and 1.3749 (the recent low).
you are currently struggling with losses, or are unsure which of the numerous trading strategies to follow, at this moment, you can choose to observe the operations within our channel.

Short Idea EURUSDShorting EURUSD once liquidity is taken probably tomorrow.
I set a Sell limit order and I will scale in once we have a new bearish 15m FVG formed after reaching the 15m OB.

BITCOIN 's 'Final 6 months rally' kickstarts the Altseason!This isn't the first time we show you this chart but it couldn't be more relevant than today. We have established on previous analyses how Bitcoin (BTCUSD) has most likely started the final rally of its Cycle, historically the parabolic rally of the last 6 months of the Bull Cycle that ends with its Top.
The addition of today's analysis is that with Bitcoin Dominance (orange trend-line) approaching its 8-year Lower Highs trend-line, this 'Final 6 months rally' of BTC is what technically also starts the Altseason. This is when lower cap coins see massive gains compared to the high cap ones.
At the same time, we get one more confirmation of why a $150k BTC Target is realistic, as by the end of 2025, this price would still be on the 0.618 Fibonacci level of the 8-year Fib Channel Up, a rather 'bad case' scenario based on this pattern.
So what do you think? Will BTC's Final 6 months rally spark a massive Altseason too? Feel free to let us know in the comments section below!
-------------------------------------------------------------------------------
** Please LIKE 👍, FOLLOW ✅, SHARE 🙌 and COMMENT ✍ if you enjoy this idea! Also share your ideas and charts in the comments section below! This is best way to keep it relevant, support us, keep the content here free and allow the idea to reach as many people as possible. **
-------------------------------------------------------------------------------
💸💸💸💸💸💸
👇 👇 👇 👇 👇 👇

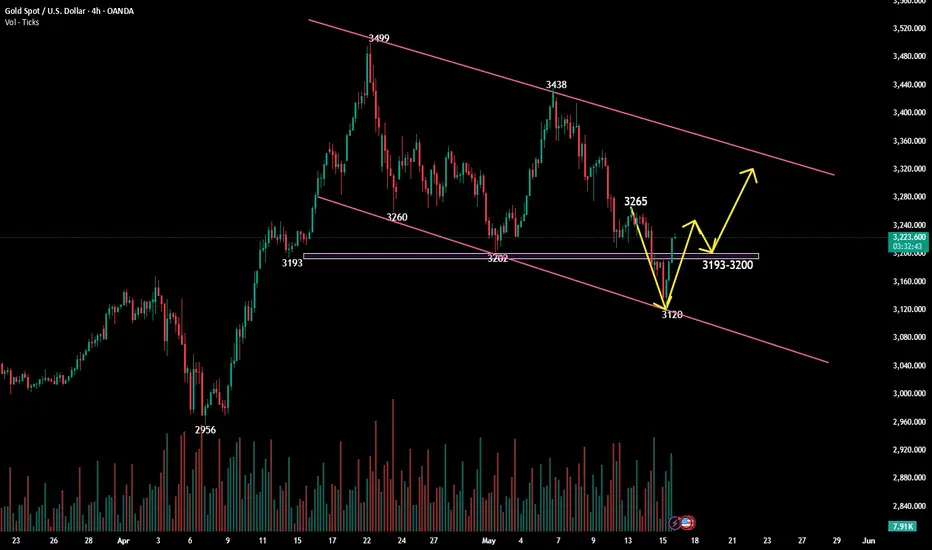
Gold Intraday Trading Plan 5/16/2025As mentioned yesterday, since my weekly target of 3165 was met, I would be cautious in placing buying orders. Indeed, after reaching 3120, gold quickly turned and closed above 3200. It is now quite bullish. I will place only buying orders today.
I am looking to buy from 3200-3210 level or the breaking of 3270. Targeting 3340.

Is the V-shaped rebound of gold a lure to buy or a reversal?At the daily level, gold is still in a high-level oscillation pattern. The previous second wave of decline target has not been fully realized, and it is difficult to confirm a reversal after a rebound of more than 70 points. On the hourly chart, after the low point of 3120, it presents a slow rise pattern. This structure is usually accompanied by gradual adjustments, and it is not advisable to speculate on the top too early. At present, the short-term support of gold is focused on the 3200-3205 area, and the resistance is at 3255-3260.

EUR/NZD is Showing Strong Bullish MomentumEUR/NZD is showing strong bullish momentum: The pair has been moving upwards since reaching the support level at 1.8807, and the bulls have been in control since then.
We expect the first target at 1.9130 to be reached soon.
If the price breaks above this level with strong momentum, the next target is 1.9245.
Overall, buyers seem to be driving the market.

DyDx is reversing. Superb opportunityDyDx chart is looking good.
On 3D timeframe StochRSI is high - good momentum is building up
RSI started to make higher low
Price is testing 21MA and should break it soon
Also bullish divergence on RSI
1st impulse could be to 4-6$ region with huge correction afterwards.
Later in summer probably will see rise to 17$+

DAX WILL KEEP GROWING|LONG|
✅DAX is trading in an uptrend
And the index made a bullish
Breakout of the key horizontal
Level of 23,400 and the breakout
Is confirmed so we are bullish
Biased and we will be expecting
A further bullish move up
LONG🚀
✅Like and subscribe to never miss a new idea!✅
Disclosure: I am part of Trade Nation's Influencer program and receive a monthly fee for using their TradingView charts in my analysis.

Gold’s Make-or-Break Level: $3167 Is the Key to the Next MoveGold Spot is sitting at a critical inflection point — and if you’ve been watching the charts, you know exactly where the pressure is building: the $3167 zone.
This level has acted as a mid-term support floor, cushioning gold’s recent corrections and providing bulls with a lifeline. But that cushion is now getting thinner, and if price action breaks below this area decisively, the implications could be sharply bearish.
👀Why $3167 Matters👀
Take a look at the recent structure. Every bounce, every bullish attempt in the past week, has leaned on $3167. It's not just some random line — it’s where buyers have consistently stepped in to defend.
But now? The bounces are getting weaker. Volume’s fading. And price is consolidating right above support — never a good sign.
If gold breaks $3167 and closes below it, expect an acceleration to the downside. Momentum traders will likely pile in, and we could see a quick slide into the $3075–3052 zone, where the next real demand sits.
✨What I’m Watching✨
A clean hourly candle close below $3167 — ideally with follow-through volume.
Any retest of $3167 after a breakdown could offer a textbook entry for shorts.
🎁The Bearish Scenario
If the break happens, I’ll be targeting $3052 for the first bounce. That’s where previous accumulation kicked in — and it lines up with a cluster of reaction lows from late April. It’s also a psychological round number and a potential spot for intraday reversal plays.

Gold's V-shaped reversal restarts its upward trend!Technical analysis of gold: Gold has a perfect V-shaped reversal today. It opened at 3177 and fell unilaterally in the Asian session. After touching 3120, it rose slowly. As of the time of writing, it has completely recovered its decline and is currently trading around 3220. I have analyzed the European session. After the gold price broke through the extreme drop of 3200, it needs to be repaired, but it has taken another rebound correction. The analysis also gave attention to 3198 to 3202 to continue to be bearish. With the slow rise and break, the bearish view is invalid. Now make a new analysis.
From a technical point of view, gold is now back above 3200, and the daily line is a big positive. It is undoubtedly absolutely strong. The key point is the gains and losses of 3200. If the retracement does not exceed 3200, then gold is extremely strong. On Friday, we will continue to see the daily line closing positive rise, but if the retracement is below 3200, the daily line cycle may close again, and there will be a continuous rebound to 3235 and 3260. Therefore, the key point today is to pay attention to the gains and losses of 3200.
The performance of the 4-hour cycle may now bottom out in the medium term. After the decline and rebound, the 4-hour mid-term Bollinger opening is temporarily strong, but if the US market rebounds continuously and stands firm at 3200, there will be a continuous positive pattern at the bottom, breaking the 5-day and 10-day moving averages, then there is a great possibility that it will go to 3235. Therefore, gold in the late trading should not be inertially bearish because of the decline on Wednesday. Even if it is bearish, it is necessary to observe the gains and losses of 3200. As for trading, first pay attention to 3200 below and try to buy, and see if 3230 breaks and 3250 breaks.
On the whole, today's short-term operation of gold suggests that callbacks should be the main focus, and rebound shorts should be supplemented. The top short-term focus is on the first-line resistance of 3250-365, and the bottom short-term focus is on the first-line support of 3193-3200. All friends must keep up with the rhythm.
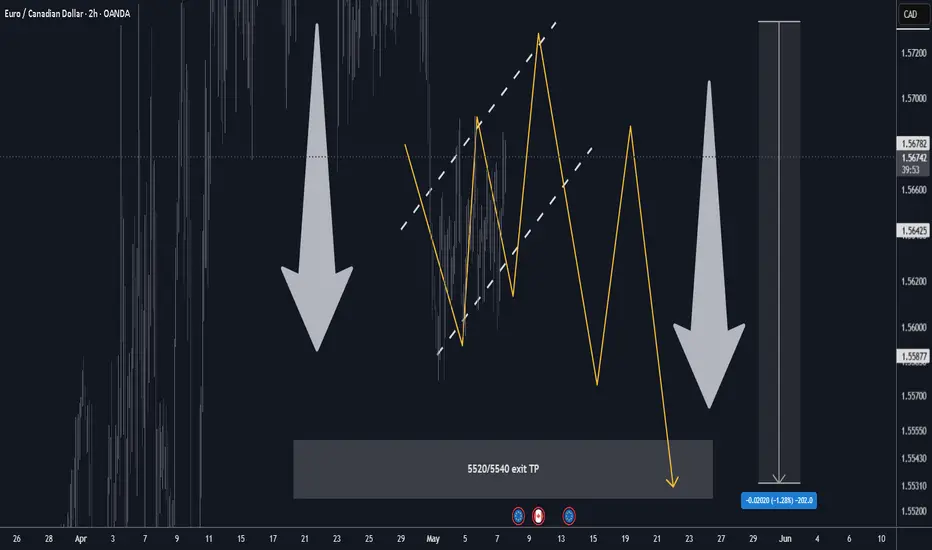
EURCAD H2 Best Level to SHORT/HOLD +100/+200 pips🏆 EURCAD Market Update H2 chart
📊 Technical Outlook
🔸broke down on high vol
🔸compression BEAR FLAG
🔸Mid-term: BEARS 5500
🔸Status: compression/dump
🔸5710/5720 heavy S/R BEARS
🔸5520/5540 key s/r zones below
🔸Price Target Bears: 5520
🔸final pump possible
🔸strategy: SHORT SELL 5710/5720
🔸SL 40 pips TP1 +100 pips TP2 +200 pips
🔸swing trade setup for patient traders
📊 Forex Market Update (May 7, 2025)
🇪🇺 EUR/USD
📉 Price: \~1.1370
USD strength ahead of Fed dampens Euro
German HCOB Services PMI fell in April; ECB rate-cut bets rising
Key Levels: Support 1.1320 | Resistance 1.1380
🇬🇧 GBP/USD
📉 Price: \~1.3320 (slid from recent highs)
Modest USD buying ahead of Fed decision
BoE policy caution keeps Pound in check
Key Levels: Support 1.3300 | Resistance 1.3400
🇺🇸 DXY (US Dollar Index)
📈 Price: \~99.39
Supported by rising U.S. yields and Fed rate-cut delays
Pressured by strategic uncertainty and trade tensions
Key Levels: Support 98.00 | Resistance 100.00
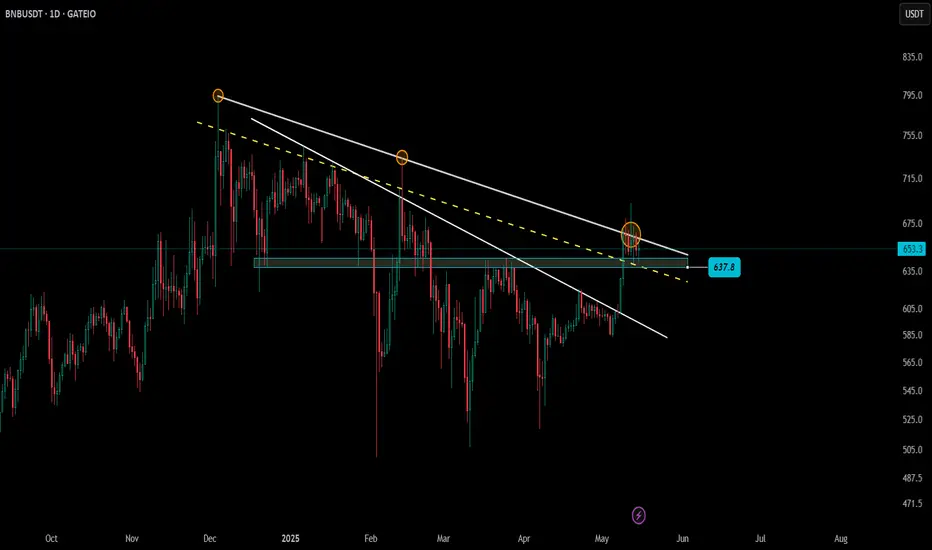
BNB Daily Chart – Trendline Break or Rejection?🚨 BNB – Trendline Test in Progress
📊 On the daily timeframe, BNB is pushing up against key trendline resistance 🔼
A successful breakout here could ignite fresh bullish momentum, while a rejection might lead to another retest lower.
👀 Crucial moment playing out—watch the reaction closely!
CAN THE CYPHER SAVE CONOCO?Slow reaction on this Bullish Cypher but there appears to be some light at the end of the tunnel if the technicals can outduel the fundamentals...

Navitas - No where to go but up!This slowly reacting Gartley is finally showing some life. Could NVTS use this to get to at least $48?

Hamad//@version=5
indicator("قالب مؤشرات الاتجاه - TradingView", overlay=true)
// المتوسطات المتحركة EMA 50 و EMA 200
ema50 = ta.ema(close, 50)
ema200 = ta.ema(close, 200)
plot(ema50, color=color.blue, title="EMA 50")
plot(ema200, color=color.orange, title="EMA 200")
// بارابوليك سار
sar = ta.sar(0.02, 0.02, 0.2)
plotshape(series=sar < close, location=location.belowbar, color=color.green, style=shape.triangleup, title="SAR Buy Signal")
plotshape(series=sar > close, location=location.abovebar, color=color.red, style=shape.triangledown, title="SAR Sell Signal")
// ADX
adx = ta.adx(14)
hline(25, "ADX 25", color=color.gray)
plot(adx, title="ADX", color=color.purple, linewidth=2, overlay=false)
// إيشيموكو
conversionLine = ta.sma(ta.highest(high, 9) + ta.lowest(low, 9), 2)
baseLine = ta.sma(ta.highest(high, 26) + ta.lowest(low, 26), 2)
leadingSpanA = ta.sma(conversionLine + baseLine, 2)
leadingSpanB = ta.sma(ta.highest(high, 52) + ta.lowest(low, 52), 2)
plot(conversionLine, title="Tenkan-sen", color=color.green)
plot(baseLine, title="Kijun-sen", color=color.red)
plot(leadingSpanA, title="Senkou Span A", color=color.green, style=plot.style_area, transp=80)
plot(leadingSpanB, title="Senkou Span B", color=color.red, style=plot.style_area, transp=80)

