OPEN-SOURCE SCRIPT
ATR X-Power
Uppdaterad
ATR X-Power is a simple graphical representation of Average True Range.
The ATR is calculated on a daily basis and averaged over the "Length" specified in settings (default is 14 days).
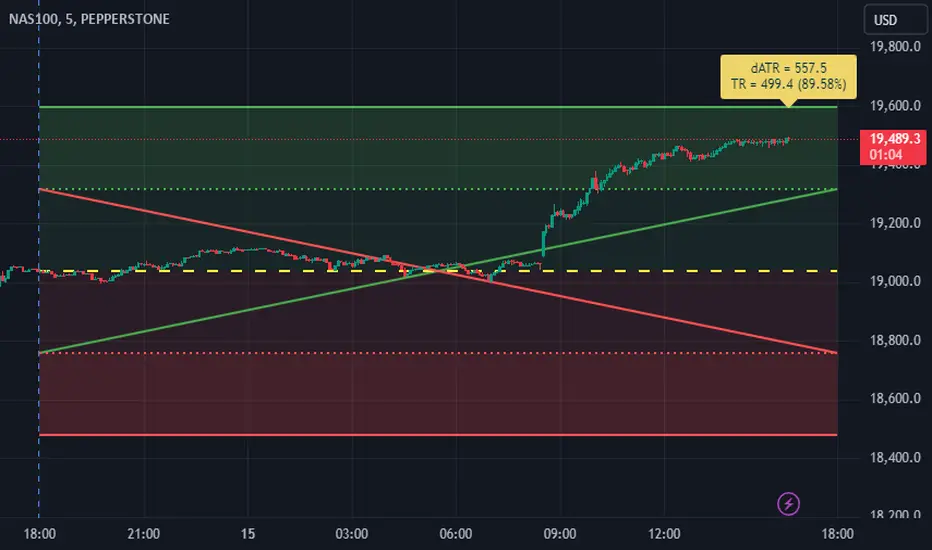
At the start of the day, the starting price is recorded and five horizontal lines are drawn which illustrate possible ranges for the day:
The final two lines are drawn using the ATR half values in such a way that a X is formed. The X represents possible motion of the price back to starting price (also known as reversion to mean). The two lines are drawn as follows:
Use cases:
Bugs?
Kindly report any issues you run into and I'll try to fix them promptly.
Thank you!
The ATR is calculated on a daily basis and averaged over the "Length" specified in settings (default is 14 days).
At the start of the day, the starting price is recorded and five horizontal lines are drawn which illustrate possible ranges for the day:
- Starting price
- Starting price + ATR (+100%)
- Starting price - ATR (-100%)
- Starting price + ATR/2 (+50%)
- Starting price - ATR/2 (-50%)
The final two lines are drawn using the ATR half values in such a way that a X is formed. The X represents possible motion of the price back to starting price (also known as reversion to mean). The two lines are drawn as follows:
- Beginning at (Starting Price + ATR/2) and ending at (Starting Price - ATR/2)
- Beginning at (Starting Price - ATR/2) and ending at (Starting Price + ATR/2)
Use cases:
- ATR presents us with the average amount of price fluctuation we can expect to see in a single day on a specific instrument
- If price is near the extremes (+/-100% ATR) for the day, then probability of it moving outside that range is low, which increases odds of a reversal
Bugs?
Kindly report any issues you run into and I'll try to fix them promptly.
Thank you!
Versionsinformation
Expanded settings to allow for personalized color choicesVersionsinformation
Cleaned up commented codeVersionsinformation
Adjusted how the Session time change is calculated, so it now behaves properly on more instrumentsVersionsinformation
Added a label that shows the user the daily ATR (dATR) and true range (TR) as well as percentage of dATR. The label moves to the nearest level, so it stays within view but also doesn't get in the way.Versionsinformation
- ATR data window now shows the proper values for different instruments- ATR data window can now be disabled in settings
- ATR data window font size can be chosen in settings
- ATR X initializes off previous candles close
Skript med en öppen källkod
In true TradingView spirit, the author of this script has published it open-source, so traders can understand and verify it. Cheers to the author! You may use it for free, but reuse of this code in publication is governed by House rules. Du kan ange den som favorit för att använda den i ett diagram.
Frånsägelse av ansvar
Informationen och publikationerna är inte avsedda att vara, och utgör inte heller finansiella, investerings-, handels- eller andra typer av råd eller rekommendationer som tillhandahålls eller stöds av TradingView. Läs mer i Användarvillkoren.