OPEN-SOURCE SCRIPT
Volume Bollinger Bands
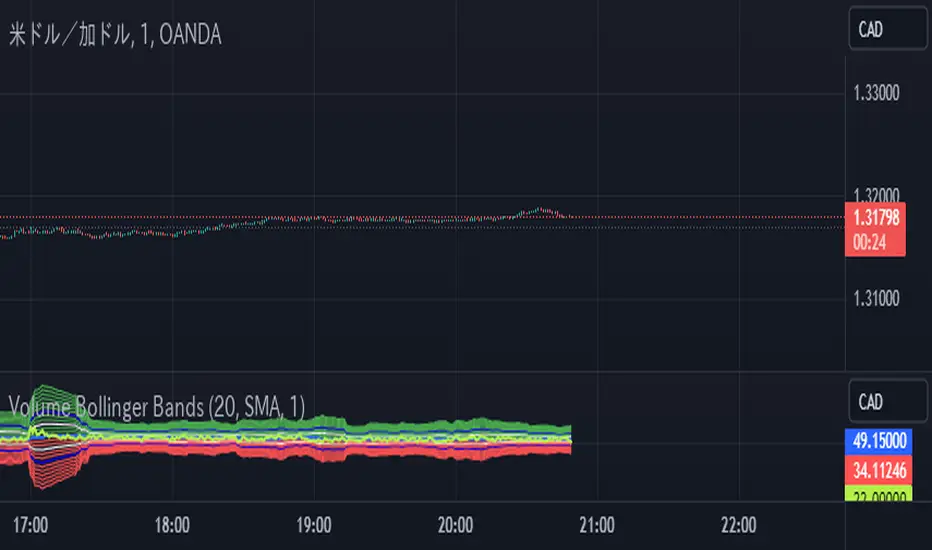
This code draws a custom indicator named "Volume Bollinger Bands" on the price chart with the following visual elements:
1. **Basis Line (Blue)**: This line represents the moving average value (ma_value) of the volume data calculated based on the user-selected moving average type (SMA, EMA, or WMA) and length.
2. **Upper Bands (Green)**: The upper bands are calculated by adding a certain multiple of the standard deviation (dev1 to dev11) to the basis line. These bands represent a certain level of volume volatility above the moving average.
3. **Lower Bands (Red)**: The lower bands are calculated by subtracting a certain multiple of the standard deviation (dev1 to dev11) from the basis line. These bands represent a certain level of volume volatility below the moving average.
4. **Volume Line (Yellow)**: This line represents the volume data for the selected timeframe, plotted over the price chart.
The user can customize the following parameters:
- Average Length: The length of the moving average.
- Moving Average Type: The type of moving average to be used (SMA, EMA, or WMA).
- Timeframe: The timeframe used to calculate the volume data.
- Deviation 1 to Deviation 11: Multipliers for calculating the upper and lower bands.
The purpose of this indicator is to visually represent the relationship between volume volatility, moving average, and price movements. Traders can use it to analyze changes in volume trends and potential price breakouts or reversals when the volume moves beyond certain levels of standard deviations from the moving average.
Skript med en öppen källkod
In true TradingView spirit, the author of this script has published it open-source, so traders can understand and verify it. Cheers to the author! You may use it for free, but reuse of this code in publication is governed by House rules. Du kan ange den som favorit för att använda den i ett diagram.
Frånsägelse av ansvar
Informationen och publikationerna är inte avsedda att vara, och utgör inte heller finansiella, investerings-, handels- eller andra typer av råd eller rekommendationer som tillhandahålls eller stöds av TradingView. Läs mer i Användarvillkoren.