OPEN-SOURCE SCRIPT
Inside Candle by Harshini
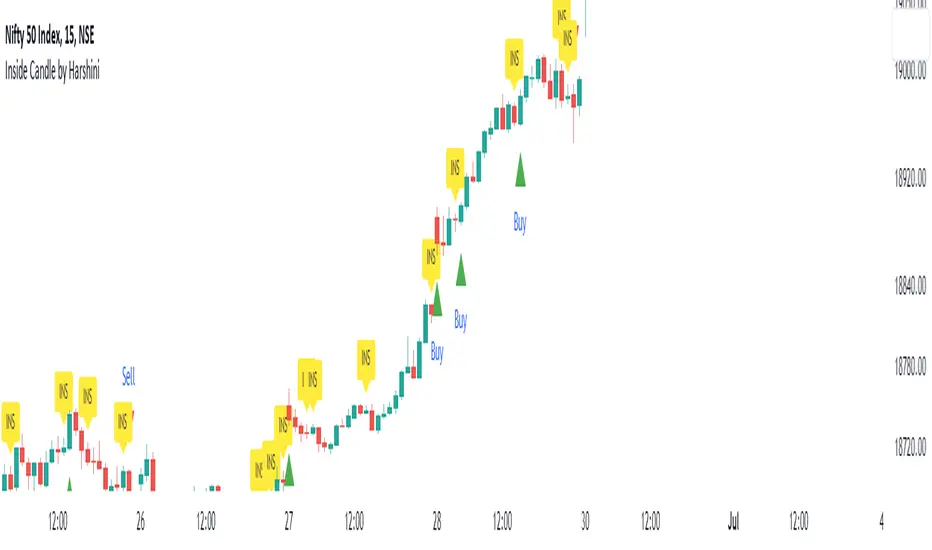
The concept behind this indicator is that the inside candle indicates a pause in the current move and the following candle after inside candle will indicate the direction of the next move. This indicator informs you when an inside candle is formed and based on the next candle, it gives you buy/sell signal.
When an inside candle is formed, a label will appear above the candle, which makes it very easy to identify the inside candle in live charts. Once the inside candle is formed, the Buy/Sell signal depends on the next candle. If the candle formed after the inside candle gives a breakout above then "Buy" signal is indicated, you can take a trade with 1:2 risk reward. Similarly if the next candle gives a breakout below, then a "Sell" signal is generated and you can take a sell with 1:2 risk reward. This indicator can be applied to any chart like stocks, crypto, commodities etc...
Here's how you can trade using this indicator:
1) Apply this indicator in a 15 mins time frame :
Even though this indicator identifies inside candle formation in almost every time frame, it works very well when applied to a 15 mins chart.
2) Always keep minimum 1:2 Risk Reward :
While taking trades initially, stick on to 1:2 risk reward. If there are other confluences as well along with the inside candle, you can book target accordingly.
Note : It is observed that this indicator works well in a trending market and not in ranging bound market.
Open-source script
In true TradingView spirit, the creator of this script has made it open-source, so that traders can review and verify its functionality. Kudos to the author! While you can use it for free, remember that republishing the code is subject to our House Rules.
Disclaimer
The information and publications are not meant to be, and do not constitute, financial, investment, trading, or other types of advice or recommendations supplied or endorsed by TradingView. Read more in the Terms of Use.