OPEN-SOURCE SCRIPT
Volatility Percentage Monitor
Volatility Percentage Monitor (VPM)
What it’s meant for:
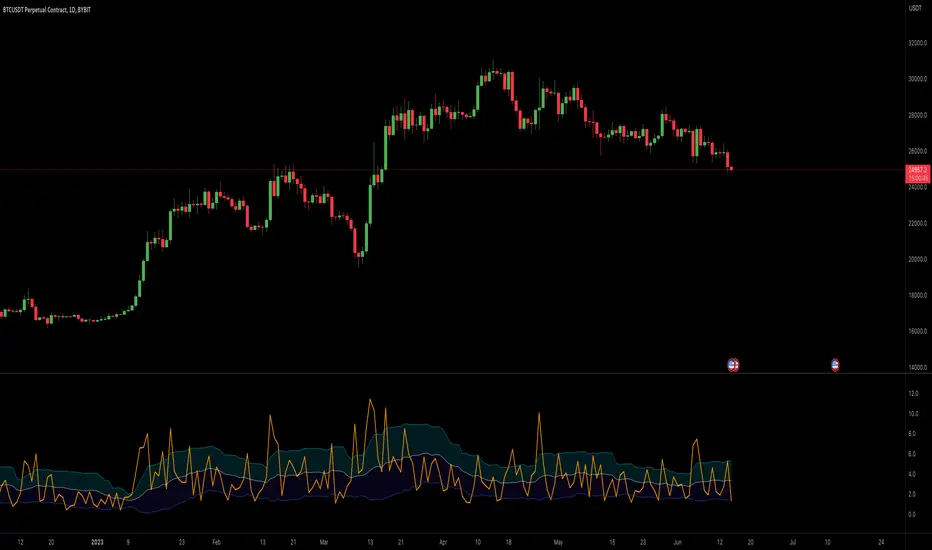
- VPM quickly shows asset volatility trend in percentage making easy to recognise how on-going price move compare to average. This is particularly useful in day-trading analysis too understand when the move possibly reaches it’s top.
- By default VPM shows a 1 period trend and Bollinger Bands on 20 periods.
How it works:
- VPM use a Simple Moving Average to reflect the exact percentage value in both daily and optional trend average measures. There’s also a switch in ‘Setting Menu’ to change the average method (Eg. You can choose RMA with a 14 period average and see a standard ATR graph on chart)
Settings:
- Additional averages can show short, mid and longterm volatility trends and can be adjusted from Setting Menu.
- An additional graph can be shown to display Standard Deviation from longterm period data: (Note: this is used to understand how reliable average data is on the given asset)
- Bollinger Bands can be turned on/off by the Setting Menu and adjusted in period and standard deviation (Suggestion: you can check standard deviation with longterm period average parameter and display trend)
- Average Method switch allow to change the calculation method for all averages with the most common methods
- The indicator is designed to be used with daily, weekly or monthly timeframe, but will work on any timeframe anyway.
- Works on any asset
Alerts:
- Preconfigured alerts can be activated to be notify on mid and top volatility daily reach
What it’s meant for:
- VPM quickly shows asset volatility trend in percentage making easy to recognise how on-going price move compare to average. This is particularly useful in day-trading analysis too understand when the move possibly reaches it’s top.
- By default VPM shows a 1 period trend and Bollinger Bands on 20 periods.
How it works:
- VPM use a Simple Moving Average to reflect the exact percentage value in both daily and optional trend average measures. There’s also a switch in ‘Setting Menu’ to change the average method (Eg. You can choose RMA with a 14 period average and see a standard ATR graph on chart)
Settings:
- Additional averages can show short, mid and longterm volatility trends and can be adjusted from Setting Menu.
- An additional graph can be shown to display Standard Deviation from longterm period data: (Note: this is used to understand how reliable average data is on the given asset)
- Bollinger Bands can be turned on/off by the Setting Menu and adjusted in period and standard deviation (Suggestion: you can check standard deviation with longterm period average parameter and display trend)
- Average Method switch allow to change the calculation method for all averages with the most common methods
- The indicator is designed to be used with daily, weekly or monthly timeframe, but will work on any timeframe anyway.
- Works on any asset
Alerts:
- Preconfigured alerts can be activated to be notify on mid and top volatility daily reach
Skript med en öppen källkod
In true TradingView spirit, the author of this script has published it open-source, so traders can understand and verify it. Cheers to the author! You may use it for free, but reuse of this code in publication is governed by House rules. Du kan ange den som favorit för att använda den i ett diagram.
Frånsägelse av ansvar
Informationen och publikationerna är inte avsedda att vara, och utgör inte heller finansiella, investerings-, handels- eller andra typer av råd eller rekommendationer som tillhandahålls eller stöds av TradingView. Läs mer i Användarvillkoren.