OPEN-SOURCE SCRIPT
Indian Markets Dashboard
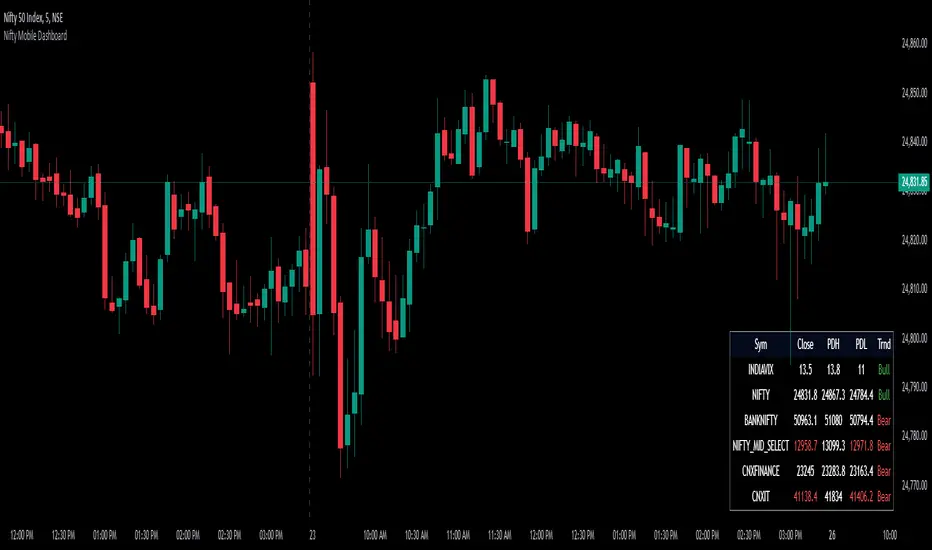
The Mobile Dashboard indicator provides a compact and customizable table on your TradingView chart, summarizing key data for up to six selected financial instruments. It displays the close price, previous day high (PDH), previous day low (PDL), and SuperTrend direction (Bull/Bear). The table's position, size, and transparency can be adjusted to suit your preferences, making it a convenient tool for quickly monitoring multiple assets on the go. Ideal for traders who need a clear and concise overview of market conditions directly on their chart.
- TraderVK
- TraderVK
Skript med en öppen källkod
In true TradingView spirit, the author of this script has published it open-source, so traders can understand and verify it. Cheers to the author! You may use it for free, but reuse of this code in publication is governed by House rules. Du kan ange den som favorit för att använda den i ett diagram.
Frånsägelse av ansvar
Informationen och publikationerna är inte avsedda att vara, och utgör inte heller finansiella, investerings-, handels- eller andra typer av råd eller rekommendationer som tillhandahålls eller stöds av TradingView. Läs mer i Användarvillkoren.