OPEN-SOURCE SCRIPT
Imbalance FVG SIBI BISI
Uppdaterad
Imbalance Detection Script
Author: © teshmi9z
Script Name: Imbalance FVG
Version: Pine Script® v5
Description:
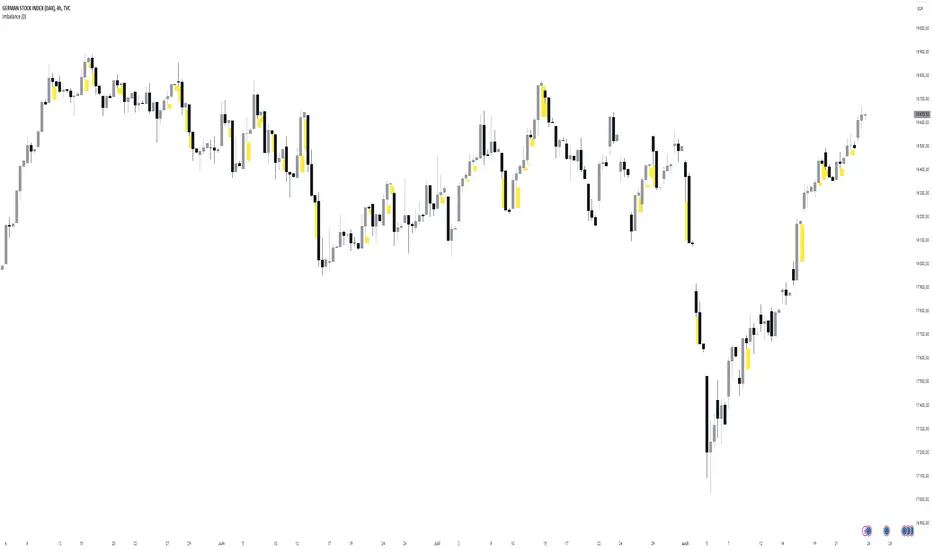
This script detects and highlights imbalances on the chart, areas where price movement has created a gap without immediate return, signaling potential zones of future support or resistance.
The script identifies two types of imbalances:
Bullish Imbalance: Occurs when the low of two bars ago is less than or equal to the previous bar's open, and the current bar's high is greater than or equal to the previous bar's close.
Bearish Imbalance: Occurs when the high of two bars ago is greater than or equal to the previous bar's open, and the current bar's low is less than or equal to the previous bar's close.
These imbalances are visualized as semi-transparent yellow boxes on the chart, which can be adjusted for transparency.
Parameters:
Transparency (FVG): Adjust the transparency of the yellow boxes, from 0 (opaque) to 100 (fully transparent).
Usage:
This script helps traders quickly identify and visualize potential reversal zones or areas of interest on the chart. It’s a useful tool for pinpointing where significant price reactions may occur.
Author: © teshmi9z
Script Name: Imbalance FVG
Version: Pine Script® v5
Description:
This script detects and highlights imbalances on the chart, areas where price movement has created a gap without immediate return, signaling potential zones of future support or resistance.
The script identifies two types of imbalances:
Bullish Imbalance: Occurs when the low of two bars ago is less than or equal to the previous bar's open, and the current bar's high is greater than or equal to the previous bar's close.
Bearish Imbalance: Occurs when the high of two bars ago is greater than or equal to the previous bar's open, and the current bar's low is less than or equal to the previous bar's close.
These imbalances are visualized as semi-transparent yellow boxes on the chart, which can be adjusted for transparency.
Parameters:
Transparency (FVG): Adjust the transparency of the yellow boxes, from 0 (opaque) to 100 (fully transparent).
Usage:
This script helps traders quickly identify and visualize potential reversal zones or areas of interest on the chart. It’s a useful tool for pinpointing where significant price reactions may occur.
Versionsinformation
Imbalance Detection ScriptAuthor: © teshmi9z
Script Name: Imbalance FVG
Version: Pine Script® v5
Description:
This script detects and highlights imbalances on the chart, areas where price movement has created a gap without immediate return, signaling potential zones of future support or resistance.
The script identifies two types of imbalances:
Bullish Imbalance: Occurs when the low of two bars ago is less than or equal to the previous bar's open, and the current bar's high is greater than or equal to the previous bar's close.
Bearish Imbalance: Occurs when the high of two bars ago is greater than or equal to the previous bar's open, and the current bar's low is less than or equal to the previous bar's close.
These imbalances are visualized as semi-transparent yellow boxes on the chart, which can be adjusted for transparency.
Parameters:
Transparency (FVG): Adjust the transparency of the yellow boxes, from 0 (opaque) to 100 (fully transparent).
Usage:
This script helps traders quickly identify and visualize potential reversal zones or areas of interest on the chart. It’s a useful tool for pinpointing where significant price reactions may occur.
Skript med en öppen källkod
In true TradingView spirit, the author of this script has published it open-source, so traders can understand and verify it. Cheers to the author! You may use it for free, but reuse of this code in publication is governed by House rules. Du kan ange den som favorit för att använda den i ett diagram.
Frånsägelse av ansvar
Informationen och publikationerna är inte avsedda att vara, och utgör inte heller finansiella, investerings-, handels- eller andra typer av råd eller rekommendationer som tillhandahålls eller stöds av TradingView. Läs mer i Användarvillkoren.