OPEN-SOURCE SCRIPT
Line Chart Shifted
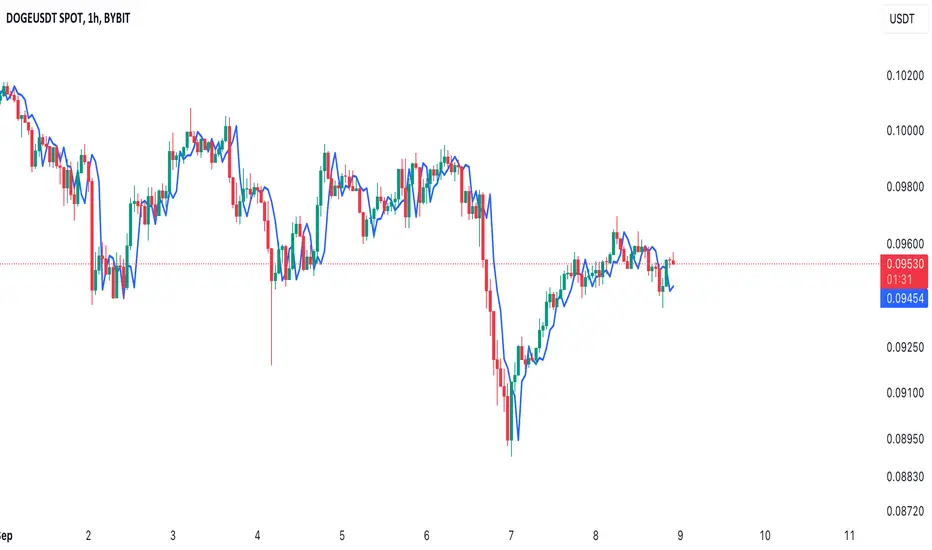
This indicator is designed to assist traders who rely on both line charts and candlestick patterns in their technical analysis. By plotting the closing price from previous bars and shifting it left by a customizable amount, this indicator overlays a line chart directly onto a candlestick chart, giving traders a clearer view of trends and key levels.
Key Features:
Shifted Close Price: The line is plotted based on the closing prices of the previous 3 candles, providing an advanced view of the market's price movements.
Customizable Line Width and Color: Traders can easily modify the thickness and color of the line to match their charting style or improve visibility when analyzing price action.
How It Helps:
Combines Line and Candlestick Charts: For traders who analyze both line and candlestick charts, this indicator provides an effective way to see how price has been evolving, helping to identify support, resistance, and trend lines more easily.
Enhanced Visualization: By shifting the line slightly to the left, the overlay offers a clean separation between the current candlestick and the historical line, improving clarity and making it easier to spot trends.
🔝 The Greatest Analysis on Earth! : t.me/invotrading
Skript med en öppen källkod
In true TradingView spirit, the author of this script has published it open-source, so traders can understand and verify it. Cheers to the author! You may use it for free, but reuse of this code in publication is governed by House rules. Du kan ange den som favorit för att använda den i ett diagram.
Frånsägelse av ansvar
Informationen och publikationerna är inte avsedda att vara, och utgör inte heller finansiella, investerings-, handels- eller andra typer av råd eller rekommendationer som tillhandahålls eller stöds av TradingView. Läs mer i Användarvillkoren.