OPEN-SOURCE SCRIPT
Support/Resistance by Oddbeaker LLC
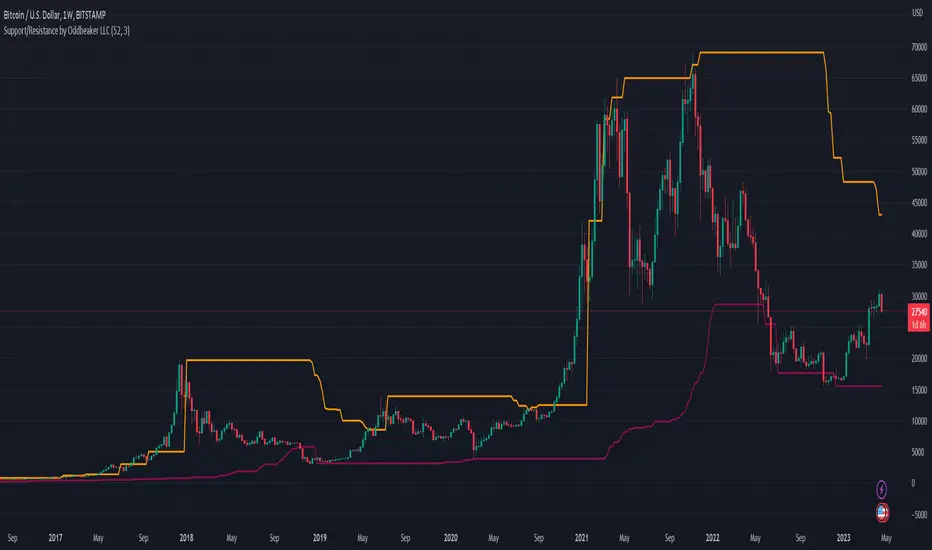
This is a port of an indicator I wrote for MT4 several years ago. At the time it was the only thing available that could accurately plot support/resistance lines in an automated way. Now there are many that do similar things, but I still think this is one of the cleanest and most straightforward ones to use.
Parameters:
Notes:
Example Chart Settings:
(c) by Oddbeaker LLC. All Rights Reserved.
Parameters:
- Signal Bars - Number of candles to look back for the high and low.
- Peak Bar - Which of the candles must be the high or low to be used as the support or resistance level.
Notes:
- Setting Peak Bar to 3 gives the most accurate results. Lower values will give false signals and higher values might be late in generating a useful signal.
- Adjust your Signal Bars according to the timeframe you use. For example, 20 days worth of candles on 1-hour or higher charts will produce strong entry signals.
Example Chart Settings:
- Weekly - 52 / 3
- Daily - 20 / 3
- 4-hour - 120 / 3
- 1-hour - 480 / 3
- 5-minute - 72 /3
- 1-minute - 240 / 3
(c) by Oddbeaker LLC. All Rights Reserved.
Skript med en öppen källkod
In true TradingView spirit, the author of this script has published it open-source, so traders can understand and verify it. Cheers to the author! You may use it for free, but reuse of this code in publication is governed by House rules. Du kan ange den som favorit för att använda den i ett diagram.
Frånsägelse av ansvar
Informationen och publikationerna är inte avsedda att vara, och utgör inte heller finansiella, investerings-, handels- eller andra typer av råd eller rekommendationer som tillhandahålls eller stöds av TradingView. Läs mer i Användarvillkoren.