OPEN-SOURCE SCRIPT
ExTreeMe Indicator
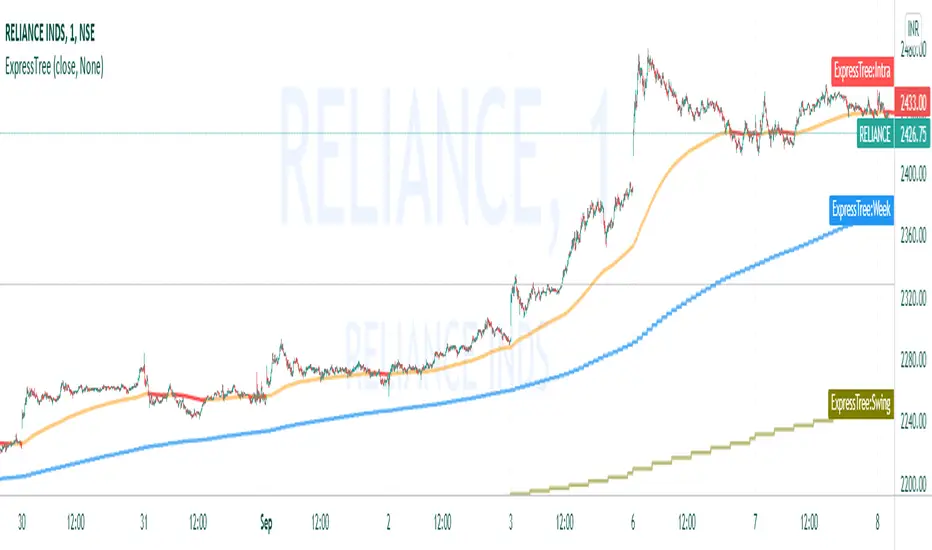
This indicator can plot of 6 time frame ema with pre-calculated length for each interval.
Additionally with EMA, it calculates 6 timeframe RSI and show green zones on the chart. Green zone can be short/mid/long term.
Short term zones(only for scalping) are decided based on first 3 EMAs. Mid term zones are decided based on first 2nd-4th EMAs. Long Term are decided on last 3 EMAs.
Mid term zones are most effective for positional trades.
Green colour is the entry zone. 2 condition will give better chance of a trendy upmove.
1. EMAs have crossover-ed recently and all are very near to each other and current price
2. Green zone appears after long consolidation.
There is other colour zone which indicates RSI is in no man's land(51-49), need to be cautious then.
Exit when white band appears.
This indicator is totally independent of current chart timeframe and stays same irrespective of which time frame you select for your chart.
Creator: DeeJay
Strategy By: Express Tree from NiftyBN
Skript med en öppen källkod
In true TradingView spirit, the author of this script has published it open-source, so traders can understand and verify it. Cheers to the author! You may use it for free, but reuse of this code in publication is governed by House rules. Du kan ange den som favorit för att använda den i ett diagram.
Frånsägelse av ansvar
Informationen och publikationerna är inte avsedda att vara, och utgör inte heller finansiella, investerings-, handels- eller andra typer av råd eller rekommendationer som tillhandahålls eller stöds av TradingView. Läs mer i Användarvillkoren.