PROTECTED SOURCE SCRIPT
BF_VolVol
Uppdaterad
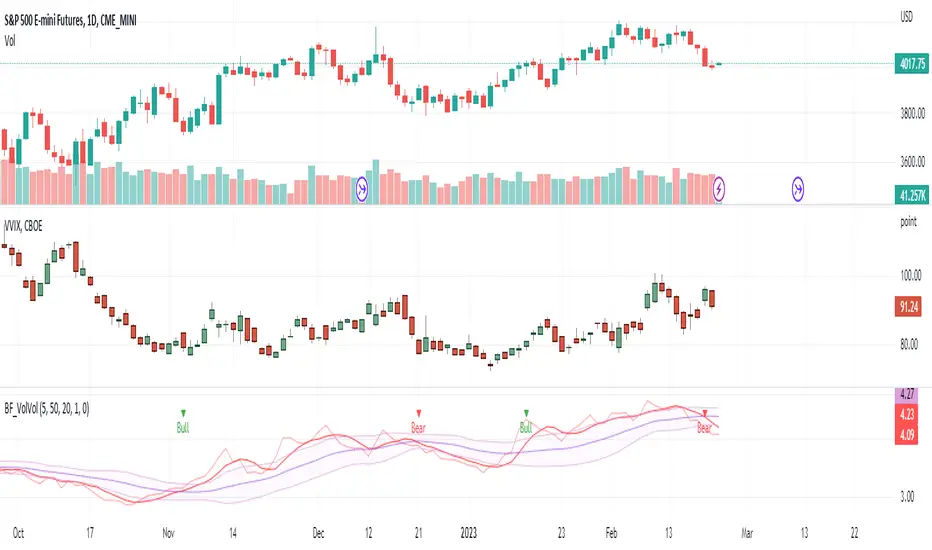
Generally VVIX, VIX of VIX is called as a volatility of volatility. Here we will calculate the ratio of VVIX over VIX and then smooth it out with 5 days SMA and it will be called as VolVol indicator.
By monitoring VolVol indicator, we can peek in the trend of S&P50 market volatility as well as investor's sentiment.
When VolVol indicator is increasing, the market volatility is decreasing and bullish sentiment,
When VolVol indicator is decreasing, the market volatility is increasing and bearish sentiment.
In addition to the 5 days SMA, 20 days look back Bollinger band is added. Note that VIX or VVIX is an expected volatility of 30-day forward price of S&P 500 or VIX respectively, and the 20 days look back period represent last 20 trading days which is equivalent to the last 30 days (approximately 20 trading days during last 30 calendar days) of realized historical price.
When 5 days SMA of VolVol is golden crossing the mid line of the Bollinger band, it is considered as a strong bullish signal and market volatility is decreasing,
When 5 days SMA of VolVol is dead crossing the mid line of the Bollinger band, it is considered as a strong bearish signal and market volatility is increasing.
Consider VolVol indicator as a psychology expression of market participants behavior and sentiment.
Versionsinformation
updated to version=5Frånsägelse av ansvar
Informationen och publikationerna är inte avsedda att vara, och utgör inte heller finansiella, investerings-, handels- eller andra typer av råd eller rekommendationer som tillhandahålls eller stöds av TradingView. Läs mer i Användarvillkoren.