OPEN-SOURCE SCRIPT
Day, Week, or Hour Coloring
Uppdaterad
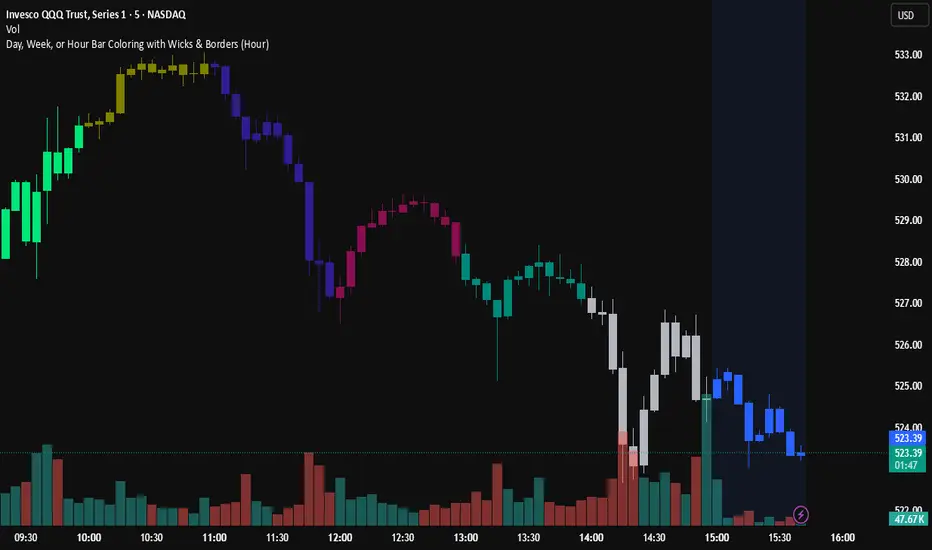
This is a simple Script that dynamically colors the chart bars based on the day of the week, week of the month, or hour of the day. Users can toggle between these three modes using the Color Mode input, allowing for flexible visual representation of time periods directly on the chart.
Key Features:
Color Modes:
Day Mode: Colors the bars according to the day of the week, with each day assigned a unique color.
Week Mode: Colors the bars based on the week of the month, providing a different color for each week.
Hour Mode: Colors the bars according to the hour of the day, with distinct colors assigned to each hour.
How It Works:
Day Mode:
The script assigns a unique color to each day of the week (e.g., Monday is red, Tuesday is green).
Week Mode:
The script calculates the week of the month by considering the first day of the month and adjusts the day count to determine the correct week.
Each week is assigned a specific color (e.g., Week 1 is red, Week 2 is green).
Hour Mode:
The script assigns a unique color to each hour of the day (e.g., 0:00 is blue, 1:00 is green).
Selected Color Application:
The script evaluates the selected Color Mode and applies the corresponding color to the bars on the chart using the barcolor() function.
This indicator is useful for traders who want to visually distinguish time periods on their charts, aiding in pattern recognition and time-based analysis.
Versionsinformation
updated screenshot. this script will simply color the candle for hour, day,or week, depending on user selection in the settings. It can help to quickly visualize how price reacts to new periods.Skript med en öppen källkod
In true TradingView spirit, the author of this script has published it open-source, so traders can understand and verify it. Cheers to the author! You may use it for free, but reuse of this code in publication is governed by House rules. Du kan ange den som favorit för att använda den i ett diagram.
Frånsägelse av ansvar
Informationen och publikationerna är inte avsedda att vara, och utgör inte heller finansiella, investerings-, handels- eller andra typer av råd eller rekommendationer som tillhandahålls eller stöds av TradingView. Läs mer i Användarvillkoren.