OPEN-SOURCE SCRIPT
[2024] Inverted Yield Curve
Uppdaterad
Inverted Yield Curve Indicator
Overview:
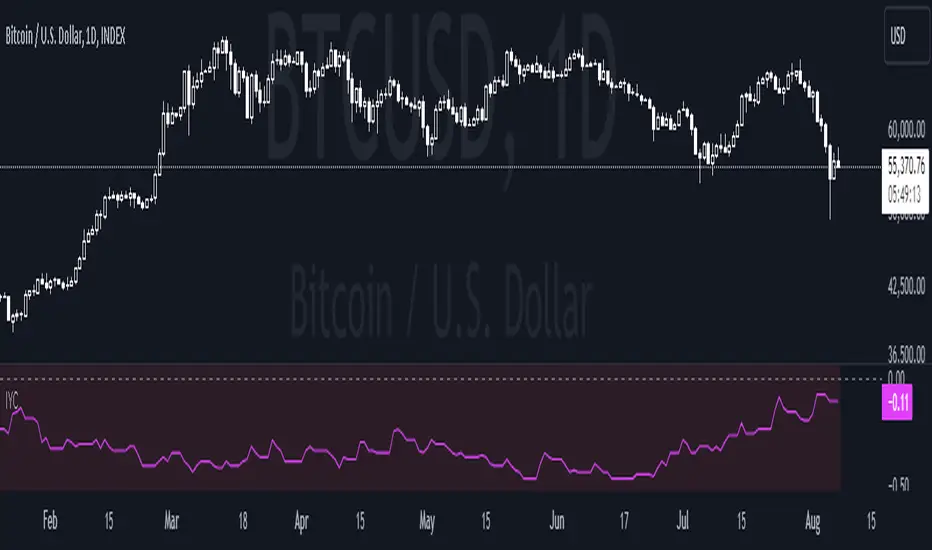
The Inverted Yield Curve Indicator is a powerful tool designed to monitor and analyze the yield spread between the 10-year and 2-year US Treasury rates. This indicator helps traders and investors identify periods of yield curve inversion, which historically have been reliable predictors of economic recessions.
Key Features:
Yield Spread Calculation: Accurately calculates the spread between the 10-year and 2-year Treasury yields.
Visual Representation: Plots the yield spread on the chart, with clear visualization of positive and negative spreads.
Inversion Highlighting: Background shading highlights periods where the yield curve is inverted (negative spread), making it easy to spot critical economic signals.
Alerts: Customizable alerts notify users when the yield curve inverts, allowing timely decision-making.
Customizable Yield Plots: Users can choose to display the individual 2-year and 10-year yields for detailed analysis.
How It Works:
Data Sources: Utilizes the Federal Reserve Economic Data (FRED) for fetching the 2-year and 10-year Treasury yield rates.
Spread Calculation: The script calculates the difference between the 10-year and 2-year yields.
Visualization: The spread is plotted as a blue line, with a grey zero line for reference. When the spread turns negative, the background turns red to indicate an inversion.
Customizable Plots: Users can enable or disable the display of individual 2-year and 10-year yields through simple input options.
Usage:
Economic Analysis: Use this indicator to anticipate potential economic downturns by monitoring yield curve inversions.
Market Timing: Identify periods of economic uncertainty and adjust your investment strategies accordingly.
Alert System: Set alerts to receive notifications whenever the yield curve inverts, ensuring you never miss crucial economic signals.
Important Notes:
Data Accuracy: Ensure that the FRED data symbols (FRED
and FRED
) are correctly referenced and available in your TradingView environment.
Customizations: The script is designed to be flexible, allowing users to customize plot colors and alert settings to fit their preferences.
Disclaimer:
This indicator is intended for educational and informational purposes only. It should not be considered as financial advice. Always conduct your own research and consult with a financial advisor before making investment decisions.
Overview:
The Inverted Yield Curve Indicator is a powerful tool designed to monitor and analyze the yield spread between the 10-year and 2-year US Treasury rates. This indicator helps traders and investors identify periods of yield curve inversion, which historically have been reliable predictors of economic recessions.
Key Features:
Yield Spread Calculation: Accurately calculates the spread between the 10-year and 2-year Treasury yields.
Visual Representation: Plots the yield spread on the chart, with clear visualization of positive and negative spreads.
Inversion Highlighting: Background shading highlights periods where the yield curve is inverted (negative spread), making it easy to spot critical economic signals.
Alerts: Customizable alerts notify users when the yield curve inverts, allowing timely decision-making.
Customizable Yield Plots: Users can choose to display the individual 2-year and 10-year yields for detailed analysis.
How It Works:
Data Sources: Utilizes the Federal Reserve Economic Data (FRED) for fetching the 2-year and 10-year Treasury yield rates.
Spread Calculation: The script calculates the difference between the 10-year and 2-year yields.
Visualization: The spread is plotted as a blue line, with a grey zero line for reference. When the spread turns negative, the background turns red to indicate an inversion.
Customizable Plots: Users can enable or disable the display of individual 2-year and 10-year yields through simple input options.
Usage:
Economic Analysis: Use this indicator to anticipate potential economic downturns by monitoring yield curve inversions.
Market Timing: Identify periods of economic uncertainty and adjust your investment strategies accordingly.
Alert System: Set alerts to receive notifications whenever the yield curve inverts, ensuring you never miss crucial economic signals.
Important Notes:
Data Accuracy: Ensure that the FRED data symbols (FRED
and FRED
) are correctly referenced and available in your TradingView environment.
Customizations: The script is designed to be flexible, allowing users to customize plot colors and alert settings to fit their preferences.
Disclaimer:
This indicator is intended for educational and informational purposes only. It should not be considered as financial advice. Always conduct your own research and consult with a financial advisor before making investment decisions.
Versionsinformation
Inverted Yield Curve IndicatorGM, the code is the same.
Please be aware that inverted yield curves are not magic. I suggest that you use it with other analysis methods.
It is hardcoded, so that you only have the spread between the 10 year yield and 2 year.
If you have futher questions and don't understand the code, feel free to comment!
The chart also doesn't have to be BTC, it is a "hardcoded" thing, since I have used the request function. Basically you can pull up the JPYUSD Chart and it will be the same result.
Historically it has been used to predict potential reversals i.e. recessions. You don't need any additional indicators or drawing to read the inverted yield curve. If it crosses zero there is a potential (potential yeah, it is not magic) recession i:e. reversal.
Stay Safe!
Skript med en öppen källkod
In true TradingView spirit, the author of this script has published it open-source, so traders can understand and verify it. Cheers to the author! You may use it for free, but reuse of this code in publication is governed by House rules. Du kan ange den som favorit för att använda den i ett diagram.
Frånsägelse av ansvar
Informationen och publikationerna är inte avsedda att vara, och utgör inte heller finansiella, investerings-, handels- eller andra typer av råd eller rekommendationer som tillhandahålls eller stöds av TradingView. Läs mer i Användarvillkoren.