OPEN-SOURCE SCRIPT
Candle Fibs [QuantVue]
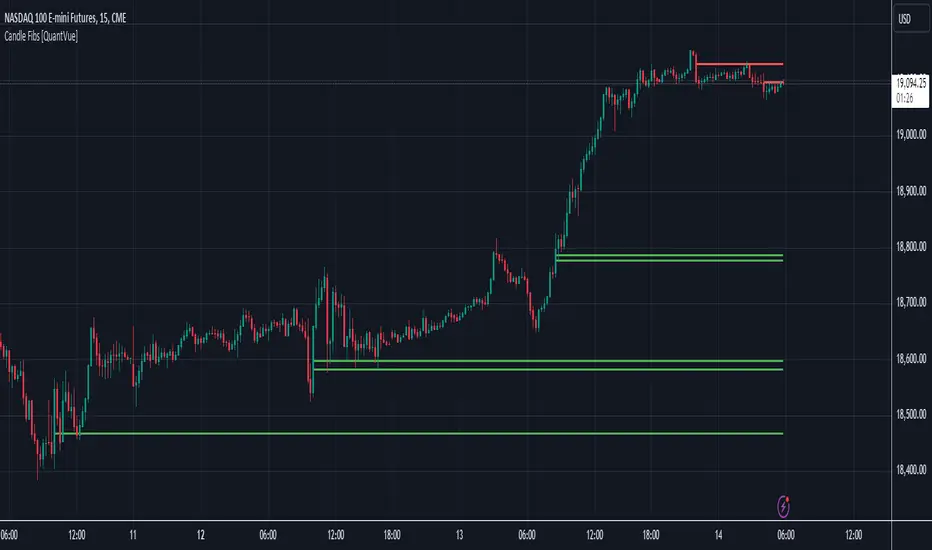
The Candles Fib indicator is designed to help traders find potential levels of support and resistance based on ATR and Fibs.
How the Indicator Works
Identification of Large Candles:
🔹The indicator begins by identifying "large candles" based on their size relative to the Average True Range (ATR).
🔹ATR (Average True Range): ATR is a technical analysis indicator that measures market volatility by averaging the true range over a specified period, default 10 periods. The true range is the greatest of the following:
🔹In this script, a candle is considered "large" if its true range (the difference between the high and low) is at least twice the ATR.
Calculation of Fibonacci Levels:
🔹Once a large candle is identified, the indicator calculates key Fibonacci retracement levels based on the size of the candle.
🔹Fibonacci Retracement: Fibonacci retracement levels are horizontal lines that indicate where support and resistance are likely to occur. These levels are derived from the Fibonacci sequence, a series of numbers where each number is the sum of the two preceding ones, often found in nature and markets.
🔹The most commonly used Fibonacci retracement levels are 0.382, 0.50, 0.618, and 0.786. In this indicator, the 0.50 and 0.618 levels are used.

Dynamic Plotting and Management of Levels:
🔹The indicator plots these Fibonacci levels as horizontal lines on the chart automatically.
🔹These lines extend as new bars (candlesticks) are formed, allowing the trader to see how the market reacts to these levels in real-time.

Give this indicator a BOOST and COMMENT your thoughts below!
We hope you enjoy.
Cheers!
How the Indicator Works
Identification of Large Candles:
🔹The indicator begins by identifying "large candles" based on their size relative to the Average True Range (ATR).
🔹ATR (Average True Range): ATR is a technical analysis indicator that measures market volatility by averaging the true range over a specified period, default 10 periods. The true range is the greatest of the following:
- The difference between the current high and current low.
- The difference between the previous close and the current high.
- The difference between the previous close and the current low.
🔹In this script, a candle is considered "large" if its true range (the difference between the high and low) is at least twice the ATR.
Calculation of Fibonacci Levels:
🔹Once a large candle is identified, the indicator calculates key Fibonacci retracement levels based on the size of the candle.
🔹Fibonacci Retracement: Fibonacci retracement levels are horizontal lines that indicate where support and resistance are likely to occur. These levels are derived from the Fibonacci sequence, a series of numbers where each number is the sum of the two preceding ones, often found in nature and markets.
🔹The most commonly used Fibonacci retracement levels are 0.382, 0.50, 0.618, and 0.786. In this indicator, the 0.50 and 0.618 levels are used.
Dynamic Plotting and Management of Levels:
🔹The indicator plots these Fibonacci levels as horizontal lines on the chart automatically.
🔹These lines extend as new bars (candlesticks) are formed, allowing the trader to see how the market reacts to these levels in real-time.
Give this indicator a BOOST and COMMENT your thoughts below!
We hope you enjoy.
Cheers!
Get Access to the exclusive QuantVue indicators: quantvue.io/
Join thousands of traders in our Free Discord: discord.gg/tC7u7magU3
Join thousands of traders in our Free Discord: discord.gg/tC7u7magU3
Skript med en öppen källkod
In true TradingView spirit, the author of this script has published it open-source, so traders can understand and verify it. Cheers to the author! You may use it for free, but reuse of this code in publication is governed by House rules. Du kan ange den som favorit för att använda den i ett diagram.
Frånsägelse av ansvar
Informationen och publikationerna är inte avsedda att vara, och utgör inte heller finansiella, investerings-, handels- eller andra typer av råd eller rekommendationer som tillhandahålls eller stöds av TradingView. Läs mer i Användarvillkoren.