OPEN-SOURCE SCRIPT
Higher Timeframe Open High Low Close
Uppdaterad
PURPOSE
1. Multi-timeframe analysis (MTFA).
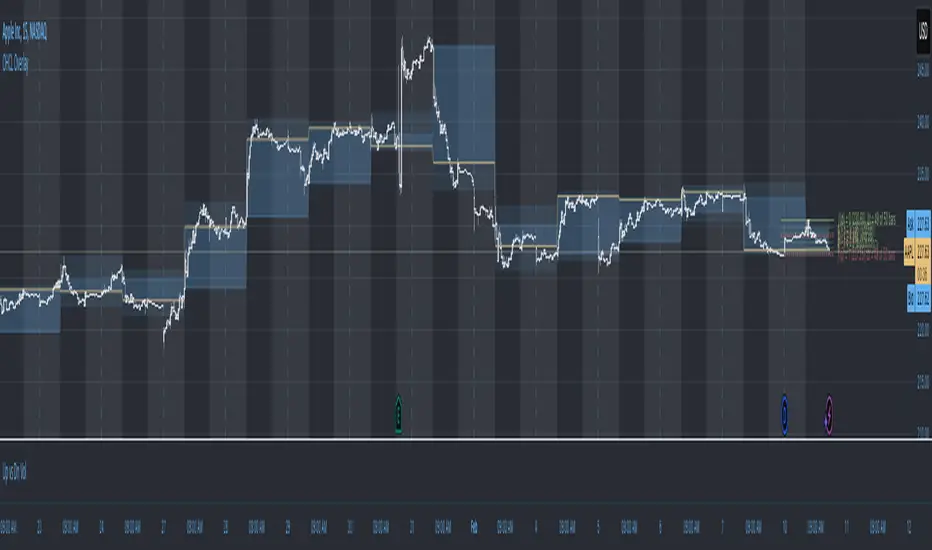
2. Better visualize intraday price action relative higher timeframe price action, and this is not limited to the current time frame or the higher time frame including current price movement.
3. Higher Timeframes provides an overview of the long-term trend (e.g., weekly or monthly charts).
4. Confirm trends occurring on more than one timeframe.
5. Improve choice of entry and exit points.
ORIGINALITY
1. Compare current lower time frame price movement to current or previous higher time frame movement. The user specifies in the settings the higher time frame (day, week, month, quarter, or year) and the associated price movement data, including OHLC, average prices, and moving average levels.
2. Previous time frames and all specified levels (OHLC, average prices, and moving averages) can be shifted together to overlay the current time frame. This allows analysis of lower/intraday price movement against that of any past higher time frames.
3. Use: In the settings, the current time frame (i.e., that including current price movement) 'count from current' is '0', a count of '1' would shift one higher level time frame such that the open date of that shifted time frame aligns with the open date of the current time frame. A count of '3' would shift three higher level time frames to align with the current."
4. Example: On the Wednesday July 24 intraday chart, overlay the daily OHLC, typical price, and 10-day EMA data occurring at the close of Wednesday July 17. This allows analyze current price movement against data from one week prior.
HIGHER TIMEFRAME DATA that can be PLOTTED and SHIFTED
1. Open, High, Low, Close.
2. Average prices: Median (HL/2), Typical (HLC/3), (Average OHLC/4), Body Median (OC/2), Weighted Close (HL2C/4), Biased 01 (HC/2 if Close > Open, else LC/2), Biased 02 (High if Close > HL/2, else Low), Biased 03 (High if Close > Open, else Low).
3. Moving averages with user specified source, length and type.
1. Multi-timeframe analysis (MTFA).
2. Better visualize intraday price action relative higher timeframe price action, and this is not limited to the current time frame or the higher time frame including current price movement.
3. Higher Timeframes provides an overview of the long-term trend (e.g., weekly or monthly charts).
4. Confirm trends occurring on more than one timeframe.
5. Improve choice of entry and exit points.
ORIGINALITY
1. Compare current lower time frame price movement to current or previous higher time frame movement. The user specifies in the settings the higher time frame (day, week, month, quarter, or year) and the associated price movement data, including OHLC, average prices, and moving average levels.
2. Previous time frames and all specified levels (OHLC, average prices, and moving averages) can be shifted together to overlay the current time frame. This allows analysis of lower/intraday price movement against that of any past higher time frames.
3. Use: In the settings, the current time frame (i.e., that including current price movement) 'count from current' is '0', a count of '1' would shift one higher level time frame such that the open date of that shifted time frame aligns with the open date of the current time frame. A count of '3' would shift three higher level time frames to align with the current."
4. Example: On the Wednesday July 24 intraday chart, overlay the daily OHLC, typical price, and 10-day EMA data occurring at the close of Wednesday July 17. This allows analyze current price movement against data from one week prior.
HIGHER TIMEFRAME DATA that can be PLOTTED and SHIFTED
1. Open, High, Low, Close.
2. Average prices: Median (HL/2), Typical (HLC/3), (Average OHLC/4), Body Median (OC/2), Weighted Close (HL2C/4), Biased 01 (HC/2 if Close > Open, else LC/2), Biased 02 (High if Close > HL/2, else Low), Biased 03 (High if Close > Open, else Low).
3. Moving averages with user specified source, length and type.
Versionsinformation
Added fibonacci data.Versionsinformation
Added labels for current chart timeframe bars above/blow the specified higher timeframe moving average (green = bars above ma, red = bar below ma), and intraday bar count (yellow = close > previous close, blow = close < previous close).Versionsinformation
* Added less common fibonacci levels* Calculate fibonacci levels with high/low price or close
* Reverse fibonacci levels
* Exclude a specified number of recent bars from fibonacci levels calculation
* Extend fibonacci level lines right/left by a specified number of bars
Versionsinformation
Added more fibonacci levels. Select to display the negative of the levels, which produces a mirror image of the levels about the zero level.Versionsinformation
Fibonacci retracement levels calculated substituting φ = (1+√5)/2 = 1.618033989 for other constants. For example:Delian constant = cube root of 2 = 2^(1/3) = 1.2599210499
Pythagoras's constant = √2 = 2^(1/2) = 1.414213562
Theodorus' constant = √3 = 3^(1/2) = 1.732050808
Square root of 5 = 5^(1/2) = 2.236067978
Silver ratio δS = 1 + 2^(1/2) = 2.414213562
Feigenbaum's α = 2.502907875...
Lorenz attractor β = 8/3 = 2.666666667
Euler's number = ∑(1/n!) = 2.718281828
Pi π = 3.141592654
Feigenbaum's 𝛿 = 4.669201609...
Versionsinformation
Added options to create retracement levels by specifying any 2 level and associated prices, all other levels will then be generated.Versionsinformation
Added tooltipsVersionsinformation
Added an option to offset the retracement and extension levels vertically by a specified price range.Versionsinformation
Calculate retracement and extension levels using the following price sources:Highest High and Lowest Low: The standard approach where the retracement is calculated using the highest high and lowest low within the lookback period.
Highest Closing Price and Lowest Closing Price: The retracement is calculated using the highest and lowest closing prices within the lookback period.
Highest Volume Bullish/Bearish Bars: The retracement is calculated using the closing prices of the bars with the highest volume, where one bar closed above its open (bullish) and the other bar closed below its open (bearish).
Versionsinformation
Typos fixedVersionsinformation
Added more ways for adjusting retracement/extension levels Versionsinformation
Fixed typos. Added extension levels.Skript med en öppen källkod
In true TradingView spirit, the author of this script has published it open-source, so traders can understand and verify it. Cheers to the author! You may use it for free, but reuse of this code in publication is governed by House rules. Du kan ange den som favorit för att använda den i ett diagram.
Frånsägelse av ansvar
Informationen och publikationerna är inte avsedda att vara, och utgör inte heller finansiella, investerings-, handels- eller andra typer av råd eller rekommendationer som tillhandahålls eller stöds av TradingView. Läs mer i Användarvillkoren.