OPEN-SOURCE SCRIPT
75: Notable Financial Crises
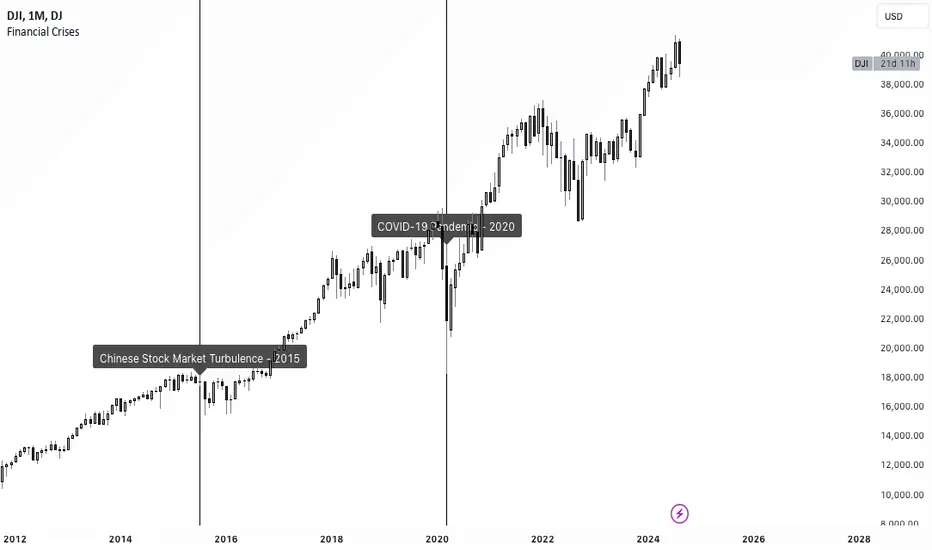
The TradingView script named "75: Notable Financial Crises" visualizes and marks significant financial crises on a financial chart.
This script plots vertical lines on the a chart corresponding to specific dates associated with notable financial crises in history. These crises could include events like the Great Depression (1929), Black Monday (1987), the Dot-com Bubble (2000), the Global Financial Crisis (2008), and others. By marking these dates on a chart, traders and analysts can easily observe the impact of these events on market behavior.
This script plots vertical lines on the a chart corresponding to specific dates associated with notable financial crises in history. These crises could include events like the Great Depression (1929), Black Monday (1987), the Dot-com Bubble (2000), the Global Financial Crisis (2008), and others. By marking these dates on a chart, traders and analysts can easily observe the impact of these events on market behavior.
Skript med en öppen källkod
In true TradingView spirit, the author of this script has published it open-source, so traders can understand and verify it. Cheers to the author! You may use it for free, but reuse of this code in publication is governed by House rules. Du kan ange den som favorit för att använda den i ett diagram.
Frånsägelse av ansvar
Informationen och publikationerna är inte avsedda att vara, och utgör inte heller finansiella, investerings-, handels- eller andra typer av råd eller rekommendationer som tillhandahålls eller stöds av TradingView. Läs mer i Användarvillkoren.