OPEN-SOURCE SCRIPT
[SGM Volatility Lvl]
Choppiness Index (CI)
The Choppiness Index is a technical analysis tool used to determine whether a market is trending or consolidating. CI values range between 0 and 100:
- Higher values (close to 100) indicate a choppy market (i.e., the market is consolidating and not trending strongly).
- Lower values (close to 0) signify a trending market (either up or down).
In this script:
- CI values above 62 are considered to represent high volatility.
- CI values below 28 are viewed as representing lower volatility or consolidation.
How the Indicator Works
Choppiness Index Calculation
The CI is calculated using the average true range (ATR) and the high-low range over the specified length:
Volatility Determination
The script determines the market's volatility state based on CI:
- ischarge = 2 indicates high volatility.
- ischarge = 0 indicates consolidation.
Line Setup
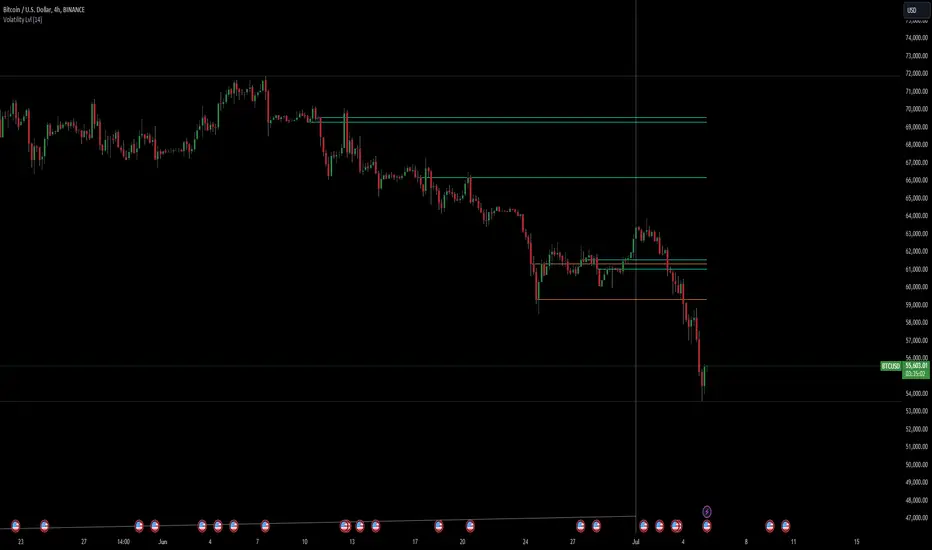
Lines are set on the chart based on the market's volatility:
- If CI increases and indicates high volatility, a line (colored with `volcolor`) is drawn at the close price of the bar.
- If CI decreases and indicates consolidation, a line (colored with `conColor`) is drawn at the close price of the bar.
Line Extension
The lines are automatically extended to the next indicator update or bar:
Relevance
Identifying Key Levels
The indicator helps traders identify key levels as follows:
- High Volatility: Lines indicating high volatility suggest strong trending movements. These levels can signify breakout points or areas where the price has made significant moves.
- Consolidation: Lines indicating consolidation suggest the market is ranging. These levels can be used to identify sideways movements, areas of accumulation or distribution, and potential breakout zones.
Potential Future Points of Interest
- High Volatility Lines: Can serve as resistance or support levels if the market revisits these areas.
- Consolidation Lines: Highlight potential zones for price breakouts or reversals when the market transitions from consolidation to a trending phase.
In summary, this indicator can be particularly useful for traders looking to identify periods of high volatility and consolidation. By marking such periods on the chart, traders can better understand market behavior and spot potential trading opportunities.
The Choppiness Index is a technical analysis tool used to determine whether a market is trending or consolidating. CI values range between 0 and 100:
- Higher values (close to 100) indicate a choppy market (i.e., the market is consolidating and not trending strongly).
- Lower values (close to 0) signify a trending market (either up or down).
In this script:
- CI values above 62 are considered to represent high volatility.
- CI values below 28 are viewed as representing lower volatility or consolidation.
How the Indicator Works
Choppiness Index Calculation
The CI is calculated using the average true range (ATR) and the high-low range over the specified length:
Volatility Determination
The script determines the market's volatility state based on CI:
- ischarge = 2 indicates high volatility.
- ischarge = 0 indicates consolidation.
Line Setup
Lines are set on the chart based on the market's volatility:
- If CI increases and indicates high volatility, a line (colored with `volcolor`) is drawn at the close price of the bar.
- If CI decreases and indicates consolidation, a line (colored with `conColor`) is drawn at the close price of the bar.
Line Extension
The lines are automatically extended to the next indicator update or bar:
Relevance
Identifying Key Levels
The indicator helps traders identify key levels as follows:
- High Volatility: Lines indicating high volatility suggest strong trending movements. These levels can signify breakout points or areas where the price has made significant moves.
- Consolidation: Lines indicating consolidation suggest the market is ranging. These levels can be used to identify sideways movements, areas of accumulation or distribution, and potential breakout zones.
Potential Future Points of Interest
- High Volatility Lines: Can serve as resistance or support levels if the market revisits these areas.
- Consolidation Lines: Highlight potential zones for price breakouts or reversals when the market transitions from consolidation to a trending phase.
In summary, this indicator can be particularly useful for traders looking to identify periods of high volatility and consolidation. By marking such periods on the chart, traders can better understand market behavior and spot potential trading opportunities.
Sigaud | Junior Quantitative Trader & Developer
Combining technical expertise with analytical precision.
Gaining experience and growing in the field.
📧 Contact: from the website
Combining technical expertise with analytical precision.
Gaining experience and growing in the field.
📧 Contact: from the website
Skript med en öppen källkod
In true TradingView spirit, the author of this script has published it open-source, so traders can understand and verify it. Cheers to the author! You may use it for free, but reuse of this code in publication is governed by House rules. Du kan ange den som favorit för att använda den i ett diagram.
Frånsägelse av ansvar
Informationen och publikationerna är inte avsedda att vara, och utgör inte heller finansiella, investerings-, handels- eller andra typer av råd eller rekommendationer som tillhandahålls eller stöds av TradingView. Läs mer i Användarvillkoren.