OPEN-SOURCE SCRIPT
Portfolio Index Generator [By MUQWISHI]
▋ INTRODUCTION:
The “Portfolio Index Generator” simplifies the process of building a custom portfolio management index, allowing investors to input a list of preferred holdings from global securities and customize the initial investment weight of each security. Furthermore, it includes an option for rebalancing by adjusting the weights of assets to maintain a desired level of asset allocation. The tool serves as a comprehensive approach for tracking portfolio performance, conducting research, and analyzing specific aspects of portfolio investment. The output includes an index value, a table of holdings, and chart plotting, providing a deeper understanding of the portfolio's historical movement.
_______________________
▋ OVERVIEW:

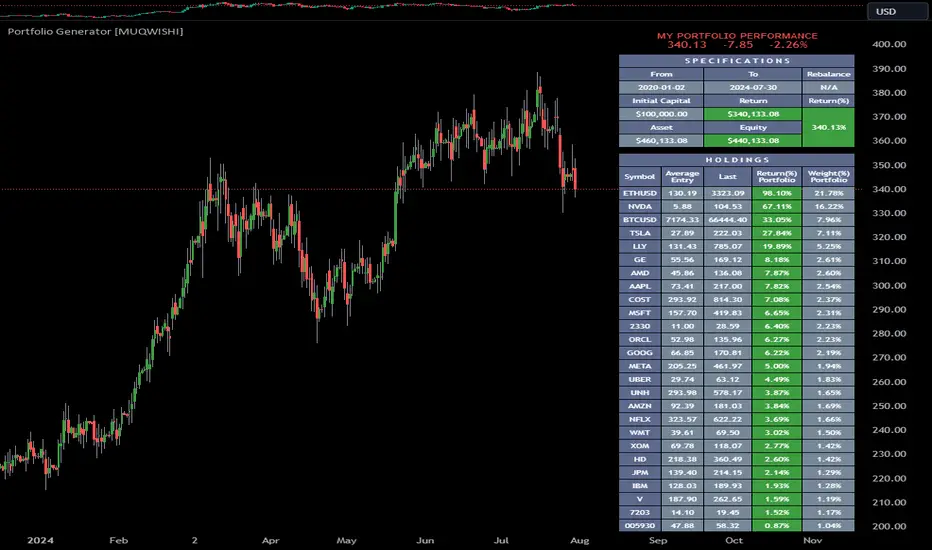
The image can be taken as an example of building a custom portfolio index. I created this index and named it “My Portfolio Performance”, which comprises several global companies and crypto assets.
_______________________
▋ OUTPUTS:
The output can be divided into 4 sections:
1. Portfolio Index Title (Name & Value).
2. Portfolio Specifications.
3. Portfolio Holdings.
4. Portfolio Index Chart.

1. Portfolio Index Title, displays the index name at the top, and at the bottom, it shows the index value, along with the chart timeframe, e.g., daily change in points and percentage.

2. Portfolio Specifications, displays the essential information on portfolio performance, including the investment date range, initial capital, returns, assets, and equity.

3. Portfolio Holdings, a list of the holding securities inside a table that contains the ticker, average entry price, last price, return percentage of the portfolio's initial capital, and customized weighted percentage of the portfolio. Additionally, a tooltip appears when the user passes the cursor over a ticker's cell, showing brief information about the company, such as the company's name, exchange market, country, sector, and industry.

4. Index Chart, display a plot of the historical movement of the index in the form of a bar, candle, or line chart.

_______________________
▋ INDICATOR SETTINGS:
Section(1): Style Settings

(1) Naming the index.
(2) Table location on the chart and cell size.
(3) Sorting Holdings Table. By securities’ {Return(%) Portfolio, Weight(%) Portfolio, or Ticker Alphabetical} order.
(4) Choose the type of index: {Equity or Return (%)}, and the plot type for the index: {Candle, Bar, or Line}.
(5) Positive/Negative colors.
(6) Table Colors (Title, Cell, and Text).
(7) To show/hide any indicator’s components.
Section(2): Performance Settings

(1) Calculation window period: from DateTime to DateTime.
(2) Initial Capital and specifying currency.
(3) Option to enable portfolio rebalancing in {Monthly, Quarterly, or Yearly} intervals.
Section(3): Portfolio Holdings

(1) Enable and count security in the investment portfolio.
(2) Initial weight of security. For example, if the initial capital is $100,000 and the weight of XYZ stock is 4%, the initial value of the shares would be $4,000.
(3) Select and add up to 30 symbols that interested in.
Please let me know if you have any questions.
The “Portfolio Index Generator” simplifies the process of building a custom portfolio management index, allowing investors to input a list of preferred holdings from global securities and customize the initial investment weight of each security. Furthermore, it includes an option for rebalancing by adjusting the weights of assets to maintain a desired level of asset allocation. The tool serves as a comprehensive approach for tracking portfolio performance, conducting research, and analyzing specific aspects of portfolio investment. The output includes an index value, a table of holdings, and chart plotting, providing a deeper understanding of the portfolio's historical movement.
_______________________
▋ OVERVIEW:
The image can be taken as an example of building a custom portfolio index. I created this index and named it “My Portfolio Performance”, which comprises several global companies and crypto assets.
_______________________
▋ OUTPUTS:
The output can be divided into 4 sections:
1. Portfolio Index Title (Name & Value).
2. Portfolio Specifications.
3. Portfolio Holdings.
4. Portfolio Index Chart.
1. Portfolio Index Title, displays the index name at the top, and at the bottom, it shows the index value, along with the chart timeframe, e.g., daily change in points and percentage.
2. Portfolio Specifications, displays the essential information on portfolio performance, including the investment date range, initial capital, returns, assets, and equity.
3. Portfolio Holdings, a list of the holding securities inside a table that contains the ticker, average entry price, last price, return percentage of the portfolio's initial capital, and customized weighted percentage of the portfolio. Additionally, a tooltip appears when the user passes the cursor over a ticker's cell, showing brief information about the company, such as the company's name, exchange market, country, sector, and industry.
4. Index Chart, display a plot of the historical movement of the index in the form of a bar, candle, or line chart.
_______________________
▋ INDICATOR SETTINGS:
Section(1): Style Settings
(1) Naming the index.
(2) Table location on the chart and cell size.
(3) Sorting Holdings Table. By securities’ {Return(%) Portfolio, Weight(%) Portfolio, or Ticker Alphabetical} order.
(4) Choose the type of index: {Equity or Return (%)}, and the plot type for the index: {Candle, Bar, or Line}.
(5) Positive/Negative colors.
(6) Table Colors (Title, Cell, and Text).
(7) To show/hide any indicator’s components.
Section(2): Performance Settings
(1) Calculation window period: from DateTime to DateTime.
(2) Initial Capital and specifying currency.
(3) Option to enable portfolio rebalancing in {Monthly, Quarterly, or Yearly} intervals.
Section(3): Portfolio Holdings
(1) Enable and count security in the investment portfolio.
(2) Initial weight of security. For example, if the initial capital is $100,000 and the weight of XYZ stock is 4%, the initial value of the shares would be $4,000.
(3) Select and add up to 30 symbols that interested in.
Please let me know if you have any questions.
Trusted Pine Programmer, I Provide Coding Services. For Inquiries
► Website muqwishi.com/home/quotation/
► Telegram t.me/MUQWISHI
⛾ Support My Work on “Buy Me a Coffee” buymeacoffee.com/muqwishi
Trusted Pine Programmer, I Provide Coding Services. For Inquiries
► Website muqwishi.com/home/quotation/
► Telegram t.me/MUQWISHI
⛾ Support My Work on “Buy Me a Coffee” buymeacoffee.com/muqwishi
Skript med en öppen källkod
In true TradingView spirit, the author of this script has published it open-source, so traders can understand and verify it. Cheers to the author! You may use it for free, but reuse of this code in publication is governed by House rules. Du kan ange den som favorit för att använda den i ett diagram.
Frånsägelse av ansvar
Informationen och publikationerna är inte avsedda att vara, och utgör inte heller finansiella, investerings-, handels- eller andra typer av råd eller rekommendationer som tillhandahålls eller stöds av TradingView. Läs mer i Användarvillkoren.