Indikatorer, strategier och bibliotek
What Is the Darvas Box? The Darvas Box strategy was developed by Nicholas Darvas. Aside from being a well known dancer, he began trading stock in the 1950s. Based on his success in trading, he was approached to write a book on his strategy. The book, “How I Made $2,000,000 in the Stock Market,” outlines his rather simple approach … simple once you understand the...
Directional Movement Oscillator is simply the difference of Di+ and Di- which helps traders to see the crosses of BUY/SELL signals more effectively. Di+ crosses above Di- when indicator crosses above 0 which can be considered as a BUY signal. and conversely Di+ crosses below Di- when indicator crosses below 0 which can be considered as a SELL...
Developed by Tim Tillson, the T3 Moving Average is considered superior to traditional moving averages as it is smoother, more responsive and thus performs better in ranging market conditions as well. However, it bears the disadvantage of overshooting the price as it attempts to realign itself to current market conditions. It incorporates a smoothing technique...
Vertical Horizontal Filter Vertical Horizontal Filter (VHF) was created by Adam White to identify trending and ranging markets. VHF measures the level of trend activity, similar to ADX in the Directional Movement System. Trend indicators can then be employed in trending markets and momentum indicators in ranging markets. Vary the number of periods in the Vertical...
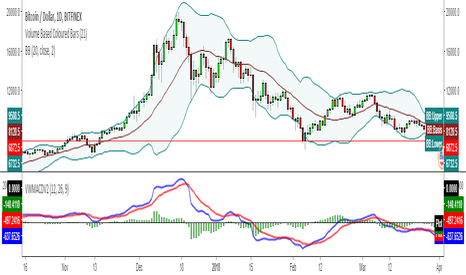
Second version of Buff Dormeier's Volume Weighted MACD indicator.... Here in this version; Exponential Moving Averages used and Weighted by Volume instead of using only vwma ( Volume Weighted Moving Averages). I personally asked Mr Dormeier, the developer of this indicator, and he confirmed this second version could be used. I personally think that this one is...
DEFINITION of 'Intraday Intensity Index' A volume based indicator that depicts the flow of funds for a security according to where it closes in its high and low range. This indicator was developed by Dave Bostian. Its goal is to track the activity of institutional block traders. A technical indicator that approximates the volume of trading for a specified...
Description: MAD stands for Moving Average Delta, it calculates the difference between moving average and price. The curve shows the difference in Pips. By calculating the delta between two points we can see more small changes in the direction of the moving average curve which are normally hard to see. You can see the MAD curve as look through the microscope at a...
Volume Based Coloured Bars: Most of the time traders are confused about if the price movements were supported by VOLUME . This indicator colors the bars into volume weighted signals... When prices go down bars are red and contraversely when up, bars are green. Additionally we have two more colors for each situation: PRICE BARS ARE: DARK RED when prices go...
TRAILING RESISTANCE INDICATOR is a helpful tool for traders to help one of the common problems that they face: where to buy/sell? by using trailing resistance you can easily decide and see possible upward movements and understand if you are in a safe zone. Using Trailing Resistance is just simple: Go long/ Buy when price crosses above the indicator, Stay on...
A2MK is a two lined indicator which gives Short and Long signals... Go long when GREEN line crosses ABOVE YELLOW Go short when YELLOW line crosses ABOVE GREEN (the default version of the indicator has the Yellow line although I personally changed the color to Orange to recognise better) You can change the length of the two lines but creator (@mavilim0732 on...
This Technique is created by Tuncer Şengöz @TuncerSengoz on twitter An uptrend with higher highs might not make new highs everyday. So how could we define the end of an uptrend? How could we tell the difference between the end of an uptrend and a temporary correction? This isolated high/low technique aims to help us in this kind of situations. We call the...
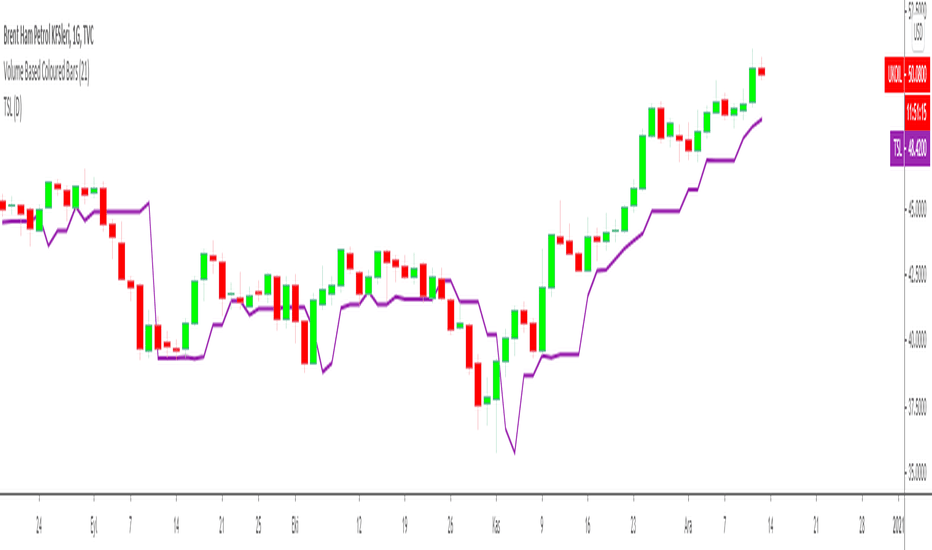
TRAILING STOP LOSS INDICATOR is a helpful tool for traders to help one of the greatest problems that they face: where to sell? by using trailing stop loss you can easily decide and see possible downward movements and understand if you are in a safe zone. Using Trailing Stop Loss is just simple: Go short/ Sell when price crosses down the indicator, Stay on...
TKE INDICATOR is created by Dr Yasar ERDINC (@yerdinc65 on twitter ) It's exactly the arithmetical mean of 7 most commonly used oscillators which are: RSI STOCHASTIC ULTIMATE OSCILLATOR MFI WIILIAMS %R MOMENTUM CCI the calculation is simple: TKE=(RSI+STOCHASTIC+ULTIMATE OSCILLATOR+MFI+WIILIAMS %R+MOMENTUM+CCI)/7 Buy signal: when TKE crosses above 20...
A combined 3in1 version of pre shared INVERSE FISHER TRANSFORM indicators on RSI , on STOCHASTIC and on CCIv2 to provide space for 2 more indicators for users... About John EHLERS: From California, USA, John is a veteran trader. With 35 years trading experience he has seen it all. John has an engineering background that led to his technical approach to...
Modified version of Squeeze Momentum Indicator including line graph of the main indicator instead of using a Histogram and a second Signal line (5 bars SMA of the original line) to provide visual BUY/SELL signals BUY when Blue crosses ABOVE the RED signal line SELL when Blue crosses BELOW the RED signal line author: LazyBear modified by: KıvanÇ @fr3762 on...
A different version of ZERO LAG EMA indicator by John Ehlers and Ric Way... In this cover, Zero Lag EMA is calculated without using the PREV function. The main purpose is that to provide BUY/SELL signals earlier than classical EMA's. You can see the difference of conventional and Zero Lag EMA in the chart. The red line is classical EMA and the blue colored...
THIS INDICATOR IS DESIGNED USING EHLERS' SUPER SMOOTHER FILTER DESIGNED FOR STOCKS (another version available for CRYPTO TRADE: Super Smoothed MACD for CRYPTO by KIVANÇ fr3762) Instead of EXPONENTIAL MOVING AVERAGES in traditional MACD calculation, Super Smoothed prices are used. The default values of BAND EDGE's (periods) of these Super Smoothed Prices are...
THIS INDICATOR IS DESIGNED USING EHLERS' SUPER SMOOTHER FILTER DESIGNED FOR CRYPTO TRADE (another version available for stocks also: Super Smoothed MACD for STOCKS by KIVANÇ fr3762) Instead of EXPONENTIAL MOVING AVERAGES in traditional MACD calculation, Super Smoothed prices are used. The default values of BAND EDGE's (periods) of these Super Smoothed Prices...


![Squeeze Momentum Indicator [LazyBear] Version2 by KıvanÇ fr3762 XRPUSD: Squeeze Momentum Indicator [LazyBear] Version2 by KıvanÇ fr3762](https://s3.tradingview.com/n/NVzKGYFJ_mid.png)


