IDX - 5UPThe UDX-5UP is a custom indicator designed to assist traders in identifying trends, entry and exit signals, and market reversal moments with greater accuracy. It combines price analysis, volume, and momentum (RSI) to provide clear buy ("Buy") and sell ("Sell") signals across any asset and timeframe, whether you're a scalper on the 5M chart or a swing trader on the 4H chart. Inspired by robust technical analysis strategies, the UDX-5UP is ideal for traders seeking a reliable tool to operate in volatile markets such as cryptocurrencies, forex, stocks, and futures.
Components of the UDX-5UP
The UDX-5UP consists of three main panels that work together to provide a comprehensive view of the market:
Main Panel (Price):
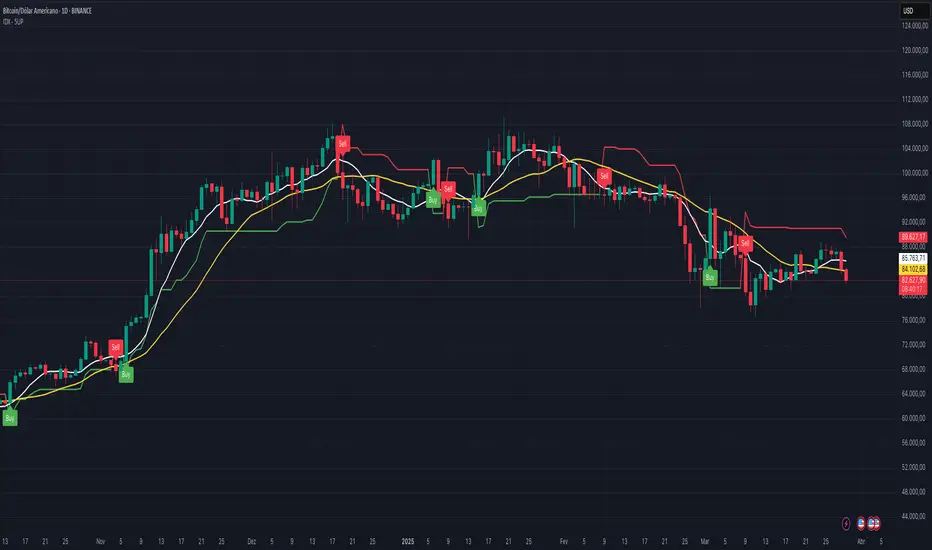
Pivot Supertrend: A dynamic line that changes color to indicate the trend. Green for an uptrend (look for buys), red for a downtrend (look for sells).
SMAs (Simple Moving Averages): Two SMAs (8 and 21 periods) to confirm the trend direction. When the SMA 8 crosses above the SMA 21, it’s a bullish signal; when it crosses below, it’s a bearish signal.
Entry/Exit Signals: "Buy" (green) and "Sell" (red) labels are plotted on the chart when entry or exit conditions are met.
Volume Panel:
Colored Volume Bars: Green bars indicate dominant buying volume, while red bars indicate dominant selling volume.
Volume Moving Average (MA 20): A blue line that helps identify whether the current volume is above or below the average, confirming the strength of the movement.
RSI Panel:
RSI (Relative Strength Index): Calculated with a period of 14, with overbought (70) and oversold (30) lines to identify momentum extremes.
Divergences: The indicator detects divergences between the RSI and price, plotting signals for potential reversals.
How the UDX-5UP Works
The UDX-5UP uses a combination of rules to generate buy and sell signals:
Buy Signal ("Buy"):
The Pivot Supertrend changes from red to green.
The SMA 8 crosses above the SMA 21.
The volume is above the MA 20, with green bars (indicating buying pressure).
The RSI is rising and, ideally, below 70 (not overbought).
Example: On the 4H chart, the price of Tether (USDT) is at 0.05515. The Pivot Supertrend turns green, the SMA 8 crosses above the SMA 21, the volume shows green bars above the MA 20, and the RSI is at 46. The UDX-5UP plots a "Buy".
Sell Signal ("Sell"):
The Pivot Supertrend changes from green to red.
The SMA 8 crosses below the SMA 21.
The volume is above the MA 20, with red bars (indicating selling pressure).
The RSI is falling and, ideally, above 70 (overbought).
Example: On the 4H chart, the price of Tether rises to 0.05817. The Pivot Supertrend turns red, the SMA 8 crosses below the SMA 21, the volume shows red bars, and the RSI is above 70. The UDX-5UP plots a "Sell".
RSI Divergences:
The indicator identifies bullish divergences (price makes a lower low, but RSI makes a higher low) and bearish divergences (price makes a higher high, but RSI makes a lower high), plotting alerts for potential reversals.
Adjustable Settings
The UDX-5UP is highly customizable to suit your trading style:
Pivot Supertrend Period: Default is 2. Increase to 3 or 4 for more conservative signals (fewer false positives, but more lag).
SMA Periods: Default is 8 and 21. Adjust to 5 and 13 for smaller timeframes (e.g., 5M) or 13 and 34 for larger timeframes (e.g., 1D).
RSI Period: Default is 14. Reduce to 10 for greater sensitivity or increase to 20 for smoother signals.
Overbought/Oversold Levels: Default is 70/30. Adjust to 80/20 in volatile markets.
Display Panels: You can enable/disable the volume and RSI panels to simplify the chart.
How to Use the UDX-5UP
Identify the Trend:
Use the Pivot Supertrend and SMAs to determine the market direction. Uptrend: look for buys. Downtrend: look for sells.
Confirm with Volume and RSI:
For buys: Volume above the MA 20 with green bars, RSI rising and below 70.
For sells: Volume above the MA 20 with red bars, RSI falling and above 70.
Enter the Trade:
Enter a buy when the UDX-5UP plots a "Buy" and all conditions are aligned.
Enter a sell when the UDX-5UP plots a "Sell" and all conditions are aligned.
Plan the Exit:
Use Fibonacci levels or support/resistance on the price chart to set targets.
Exit the trade when the UDX-5UP plots an opposite signal ("Sell" after a buy, "Buy" after a sell).
Tips for Beginners
Start with Larger Timeframes: Use the 4H or 1D chart for more reliable signals and less noise.
Combine with Other Indicators: Use the UDX-5UP with tools like Fibonacci or the Candles RSI (another powerful indicator) to confirm signals.
Practice in Demo Mode: Test the indicator in a demo account before using real money.
Manage Risk: Always use a stop-loss and don’t risk more than 1-2% of your capital per trade.
Why Use the UDX-5UP?
Simplicity: Clear "Buy" and "Sell" signals make trading accessible even for beginners.
Versatility: Works on any asset (crypto, forex, stocks) and timeframe.
Multiple Confirmations: Combines price, volume, and momentum to reduce false signals.
Customizable: Adjust the settings to match your trading style.
Author’s Notes
The UDX-5UP was developed based on years of trading and technical analysis experience. It is an evolution of tested strategies, designed to help traders navigate volatile markets with confidence. However, no indicator is infallible. Always combine the UDX-5UP with proper risk management and fundamental analysis, especially in unpredictable markets. Feedback is welcome – leave a comment or reach out with suggestions for improvements!
Relative Strength Index (RSI)
Trend-Based Buy/Sell IndicatorThis powerful trend-based buy/sell indicator is designed to detect momentum shifts early and provide high-probability trade signals with minimal lag. It filters out false signals while ensuring you get accurate buy and sell alerts at the right time.
✨ Features
✅ Predictive Signal Detection – Identifies trend shifts before they occur, reducing lag.
✅ False Signal Filtering – Avoids misleading signals using confirmation logic.
✅ Clear Buy & Sell Labels – Visually appealing 🟢 BUY 🚀 and 🔴 SELL ⚠️ markers.
✅ Dual EMA Trend Analysis – Uses fast & slow EMAs for crossover-based signals.
✅ Works on All Markets & Timeframes – Suitable for intraday, swing, and long-term trading.
📊 How to Use
1️⃣ Buy Entry → When the fast EMA crosses above the slow EMA with confirmation.
2️⃣ Sell Entry → When the fast EMA crosses below the slow EMA with confirmation.
3️⃣ Adjust Confirmation Bars → To fine-tune signal sensitivity (default: 1).
4️⃣ Use Alongside Other Indicators → Combine with RSI, MACD, or volume-based indicators for confluence.
🚀 Why This Indicator?
This is a highly effective tool for traders who want to enter and exit trades with confidence while minimizing lag and false signals. Whether you're a day trader, swing trader, or long-term investor, this indicator will enhance your market timing and decision-making.

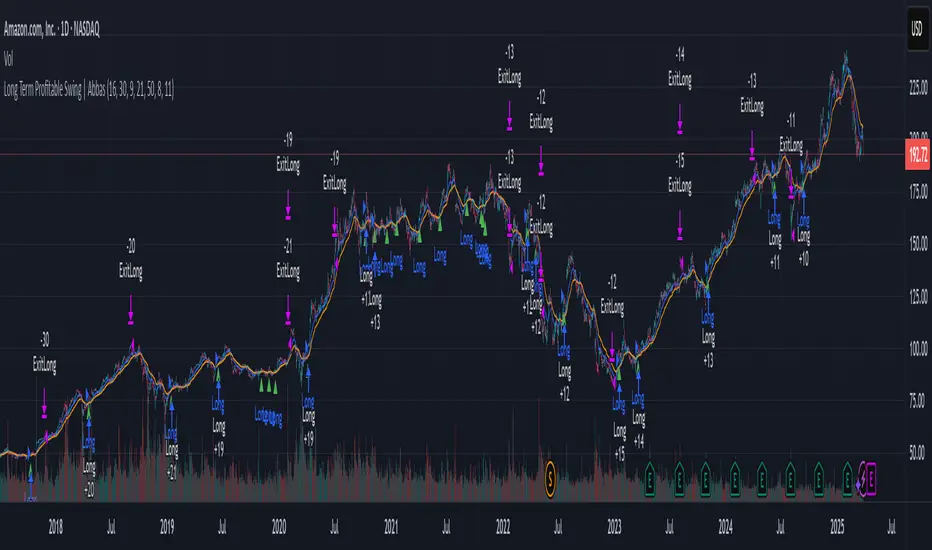
Long Term Profitable Swing | AbbasA Story of a Profitable Swing Trading Strategy
Imagine you're sailing across the ocean, looking for the perfect wave to ride. Swing trading is quite similar—you're navigating the stock market, searching for the ideal moments to enter and exit trades. This strategy, created by Abbas, helps you find those waves and ride them effectively to profitable outcomes.
🌊 Finding the Perfect Wave (Entry)
Our journey begins with two simple signs that tell us a great trading opportunity is forming:
- Moving Averages: We use two lines that follow price trends—the faster one (EMA 16) reacts quickly to recent price moves, and the slower one (EMA 30) gives us a longer-term perspective. When the faster line crosses above the slower line, it's like a clear signal saying, "Hey! The wave is rising, and prices might move higher!"
- RSI Momentum: Next, we check a tool called the RSI, which measures momentum (how strongly prices are moving). If the RSI number is above 50, it means there's enough strength behind this rising wave to carry us forward.
When both signals appear together, that's our green light. It's time to jump on our surfboard and start riding this promising wave.
⚓ Safely Riding the Wave (Risk Management)
While we're riding this wave, we want to ensure we're safe from sudden surprises. To do this, we use something called the Average True Range (ATR), which measures how volatile (or bumpy) the price movements are:
- Stop-Loss: To avoid falling too hard, we set a safety line (stop-loss) 8 times the ATR below our entry price. This helps ensure we exit if the wave suddenly turns against us, protecting us from heavy losses.
- Take Profit: We also set a goal to exit the trade at 11 times the ATR above our entry. This way, we capture significant profits when the wave reaches a nice high point.
🌟 Multiple Rides, Bigger Adventures
This strategy allows us to take multiple positions simultaneously—like riding several waves at once, up to 5. Each trade we make uses only 10% of our trading capital, keeping risks manageable and giving us multiple opportunities to win big.
🗺️ Easy to Follow Settings
Here are the basic settings we use:
- Fast EMA**: 16
- Slow EMA**: 30
- RSI Length**: 9
- RSI Threshold**: 50
- ATR Length**: 21
- ATR Stop-Loss Multiplier**: 8
- ATR Take-Profit Multiplier**: 11
These settings are flexible—you can adjust them to better suit different markets or your personal trading style.
🎉 Riding the Waves of Success
This simple yet powerful swing trading approach helps you confidently enter trades, clearly know when to exit, and effectively manage your risk. It’s a reliable way to ride market waves, capture profits, and minimize losses.
Happy trading, and may you find many profitable waves to ride! 🌊✨
Please test, and take into account that it depends on taking multiple longs within the swing, and you only get to invest 25/30% of your equity.
Cyclical Momentum PivotsCYCLICAL MOMENTUM PIVOTS
Overview
Cyclical Momentum Pivots is a streamlined indicator blending Cyclic Smoothed RSI (cRSI) with dynamic momentum detection to pinpoint high-probability trading pivots across stocks, forex, crypto, and more. Built on an adaptive cycle engine, it tracks market rhythm, delivering clear signals for momentum shifts and cyclic reversals, with an optional Hurst-style pivot forecast projected ahead of time. Powered by Pine Script v6, it uses lazy evaluation for real-time efficiency and precision.
How It Works
Momentum Signals (Green/Red Triangles)
Green Triangles (Below Bars): Trigger on volume spikes (default >2x 10-period SMA) with price surges (default ≥1.5%) or volume momentum (>20% over 5 bars).
Red Triangles (Above Bars): Same conditions with price drops.
Dynamic Tuning: Thresholds adjust via volatility (ATR, volume std dev) and cycle strength—stronger signals when cycles deviate far from a dynamic mean.
cRSI Band Crossovers (Turquoise/Purple Diamonds)
Turquoise Diamonds (Below Bars): cRSI crosses up through the low band—potential bullish pivot from oversold.
Purple Diamonds (Above Bars): cRSI crosses down through the high band—bearish pivot from overbought.
cRSI 25% Level Signals (Yellow Markers)
Yellow X (Above Bars): cRSI drops below 25% under the high band with a price decline—early bearish momentum cue.
Yellow O (Below Bars): cRSI rises above 25% over the low band with a price increase—early bullish momentum hint.
Cycle Momentum Signals (Green/Red Circles)
Green Circles (Below Bars): Cycle crosses above its dynamic mean—potential bullish acceleration.
Red Circles (Above Bars): Cycle dips below the mean—potential bearish slowdown.
Why Shorter Cycles Are Bearish, Longer Bullish: Shorter cycles (below mean) signal rapid swings—often bearish, reflecting seller-driven volatility. Longer cycles (above mean) indicate sustained trends—typically bullish, driven by buyer confidence.
Dynamic Cycle Length & Pivot Forecast
Calculation: Detects peaks/troughs over an adaptive window (scaled by smoothed cycle and sensitivity), averages distances, and smooths with an EMA (default 5). Clamped 10–40 bars. Dynamic mean adjusts to cycle length (default 2x multiplier).
Display: White number (e.g., "18") on cycle changes—off by default, toggle on via settings. Optional gray label (e.g., "P+10") forecasts bars until the next pivot, based on Hurst cycle analysis—off by default, toggle on via settings.
Hurst Pivot Forecast: Uses the average pivot period (full cycle, e.g., peak-to-peak or trough-to-trough) to predict the next pivot from the last cycle shift. Half-cycle (e.g., avgPivotPeriod / 2) marks potential midpoints, full cycle (default) targets the next major pivot, and 2x cycle (e.g., avgPivotPeriod * 2) forecasts longer-term turns—adjustable via sensitivity and multiplier settings for custom timing.
Key Features
Adaptive Cycle Engine: Peak/trough distances, smoothed with an EMA, scaled by sensitivity (default 1.0)—locks onto market rhythm.
Cycle Strength: Signals amplify with deviation from a dynamic mean—tighter thresholds in long cycles, looser in short ones.
Pivot Forecast: Optional Hurst-inspired prediction shows bars until the next pivot—enhances planning without clutter.
User Controls: Tune smoothing period (default 5), window sensitivity (0.5–2.0), and mean multiplier (1.0–5.0) for your market.
v6 Efficiency: Lazy evaluation optimizes conditions (e.g., momentumSignal and currentPriceChange > 0) for real-time precision.
Usage Tips
Timeframes: Scales from 5M to 1D—tweak settings for speed or stability.
Assets: Universal—adjust thresholds for volatility (e.g., 2.5 for crypto, 1.5 for forex).
Confirmation: Pair with support/resistance—e.g., green triangle + green circle = strong bullish pivot; red diamond + red circle = bearish pivot. Watch forecast (e.g., "P+5") for timing entries/exits.
Backtesting: Test historically—cycle strength and forecast boost accuracy in trending vs. ranging markets.
Settings
Use Auto Dominant Cycle Length: Enable (default) for adaptive cycles; disable for fixed (default 20).
Example: Enable for crypto’s wild swings; disable and set 30 for stable stocks—locks cycle to asset pace.
Base Volume Threshold: Default 2.0—raise for stricter signals, lower for more.
Example: 2.5 cuts noise in BTC/USD, 1.5 catches more in SPY—tunes signal frequency.
Base Price Change % Threshold: Default 1.5%—adjust for asset volatility.
Example: 2% for high-beta stocks, 1% for forex—matches price action scale.
Volume Momentum Lookback: Default 5—shorten for sensitivity, lengthen for stability.
Example: 3 for 5M scalping, 10 for 1D swings—sharpens momentum detection.
Show Cycle Labels: Disable (default)—enable to see cycle length changes.
Example: Enable on 1H for cycle tracking, disable on 5M for cleaner charts—reduces visual noise.
Show Pivot Forecast: Disable (default)—enable for Hurst-style next-pivot countdown.
Example: Enable on 4H for swing planning (e.g., "P+20"), disable on 15M for focus—adds timing insight.
Cycle Smoothing EMA Period: Default 5—faster (3) for volatility, slower (10) for trends.
Example: 3 smooths fast XRP cycles, 10 steadies SPX trends—reduces erratic signals.
Window Sensitivity: Default 1.0—lower (0.5) for tighter detection, higher (1.5) for broader cycles.
Example: 0.8 narrows for ETH’s chop, 1.2 widens for gold’s slow waves—tunes peak/trough precision.
Mean Multiplier: Default 2.0—shorter (1.5) for responsiveness, longer (3.0) for broader context.
Example: 1.5 tightens signals in 15M forex, 3.0 broadens for 1D indices—shifts momentum circle and forecast timing.
Show cRSI Band Crossovers: Enable (default) for cRSI signals; disable for simplicity.
Example: Enable for reversal plays, disable for momentum focus—cuts clutter.
Why It Stands Out
Cyclical Momentum Pivots’ auto-adaptive cycle—smoothed, strength-weighted, and dynamically averaged—tracks market shifts, delivering clear, actionable pivot signals with optional Hurst-style forecasting ahead of time. v6’s lazy evaluation ensures every trigger is computed efficiently, making it a go-to for traders seeking precision in momentum and reversals.

RSI14 + EMA9 + WMA45, with price ladderSummary of Main Functions
✅ Displays RSI along with EMA and WMA: Plots the 14-period RSI, 9-period EMA, and 45-period WMA to analyze price momentum.
✅ Determines price levels corresponding to specific RSI values: Calculates and displays the price needed for RSI to reach predefined levels (e.g., 20, 30, 40, 50, 60, 70, 80).
✅ Displays price labels on the chart: Adds target price labels to make it easier to identify key price zones based on RSI.
Practical Applications
🔹 Identifies potential price levels when RSI reaches key thresholds, helping predict price momentum.
🔹 Supports RSI-based trading: Traders can use this information to set buy/sell strategies at specific RSI levels.
🔹 Tracks RSI trends with EMA and WMA: EMA reacts quickly to price changes, while WMA smooths out long-term trends.

Ehlers Adaptive RSIThe Ehlers Adaptive RSI improves on the traditional RSI by dynamically adjusting its period based on market conditions.
Problem with the Classic RSI:
The traditional Relative Strength Index (RSI) uses a fixed period (e.g., 14), making it slow to react in volatile markets and too sensitive in stable conditions.
How the Adaptive RSI Solves This:
Instead of a fixed period, this version automatically adapts based on market volatility using a combination of ATR (Average True Range) and EMA (Exponential Moving Average).
Key Benefits:
More Responsive – Quickly adapts to market shifts, reducing lag.
Less Noise – Filters out unnecessary fluctuations in stable trends.
Self-Adjusting – No need to manually change RSI settings for different market conditions.
Better Signal Accuracy – Helps detect real trend reversals without false alarms.
This script is for informational and educational purposes only. It does not constitute financial advice, and past performance does not guarantee future results. Use it at your own risk.

RSI Price LadderSummary of Main Functions
✅ Converts RSI values into corresponding price levels: Helps predict how much the price needs to change to reach a specific RSI value.
✅ Displays labels and horizontal lines on the chart: Makes it easy to observe key price levels related to RSI.
✅ Provides dynamic RSI levels: RSI, EMA RSI, and WMA RSI are all plotted as target price levels.
Practical Applications
🔹 Identify potential price levels when RSI reaches overbought or oversold zones.
🔹 Support RSI-based trading: Traders can place buy/sell orders based on RSI target prices.
🔹 Monitor dynamic RSI trends with EMA and WMA lines.

Breakout/Breakdown Trading IndicatorThe Breakout/Breakdown Trading Indicator is designed to identify key market levels and highlight potential breakout and breakdown opportunities. This tool helps traders track market structure and dynamically adapt to price action.
🔹 Key Features:
✅ Automatic Support & Resistance Detection – Identifies strong price zones based on historical highs and lows.
✅ Breakout & Breakdown Alerts – Recognizes when price moves beyond critical levels, signaling potential trend shifts.
✅ Volume Confirmation (Optional) – Ensures that breakouts and breakdowns are supported by sufficient volume, reducing false signals.
✅ Customizable Parameters – Allows traders to fine-tune the lookback period and confirmation criteria for better adaptability.
✅ Seamless Chart Integration – Works smoothly on all timeframes and assets, from stocks to crypto and forex.
🔹 How It Works:
1️⃣ The indicator dynamically tracks support & resistance levels based on historical price action.
2️⃣ When the price crosses above resistance or below support, it detects a potential breakout or breakdown.
3️⃣ If enabled, volume confirmation filters out weak moves, helping traders focus on high-probability setups.
4️⃣ The indicator ensures real-time tracking and adapts to market changes efficiently.
🔹 Ideal For:
✔️ Traders looking for a structured way to identify breakout and breakdown levels
✔️ Those who prefer volume-backed price action signals
✔️ Scalpers, day traders, and swing traders who rely on dynamic support & resistance zones
🔹 Customization & Flexibility:
🛠️ Adjust lookback periods and confirmation bars for tailored results
🎨 Visually appealing support & resistance lines for enhanced chart clarity
⚡ Lightweight and optimized for smooth performance on TradingView
📌 Tip: Use this indicator alongside other confluences like trendlines, moving averages, or candlestick patterns to improve trade accuracy!

SPY Enhanced Short Signals – Fixed1.54% profit per trade
SPY Enhanced Short Signals – Fixed is a 5-minute strategy for SPY that triggers short entries when price nears resistance under confirmed bearish conditions (RSI below 45, MACD momentum, and volume spikes). It uses ATR-based dynamic exits to manage risk with adaptive take profit and stop loss settings. Customize inputs for optimal performance.

Relative Strength Indicator## ✨RS✨ by Mars: Advanced Relative Strength Indicator
This indicator solves the primary weakness of traditional RS tools: excessive choppiness and false signals. By combining three calculation methods (ratio, performance, or logarithmic comparison) with dynamic filtering techniques, it identifies true trend changes and stock leadership with significantly higher reliability.
### Key Features:
- Multi-timeframe strength analysis (default 10, 21, 63, and 200-period measurements)
- Dynamic signal line with customizable crossing alerts
- Clear visualization with color-coded fills and special crossover signals
- Reversal detection system using momentum and line convergence
- RSI-like scaling (0-100) for easier interpretation with special crossings on overbought and oversold zones.
### Trading Applications:
- Filter out market noise to identify genuine sector/asset leadership shifts
- Eliminate false signals through the convergence of multiple confirmation factors (momentum, proximity, signal crossovers)
- Detect high-probability reversals only when multiple conditions align, reducing premature entries
- Use special signals (bright triangles) for high-confidence entry/exit points when crossovers occur in extreme zones
- Monitor trend reliability through multi-timeframe RS strength percentages
Unlike conventional RS indicators that produce frequent whipsaws, this tool waits for confluent signals across multiple factors. The combination of smoothed RS readings, signal line convergence, and multi-timeframe analysis creates a comprehensive system for identifying market leadership with dramatically reduced false signals. Perfect for rotation strategies and sector allocation decisions where reliability matters more than frequency.
Video:

Volume Weighted RSI (VW RSI)The Volume Weighted RSI (VW RSI) is a momentum oscillator designed for TradingView, implemented in Pine Script v6, that enhances the traditional Relative Strength Index (RSI) by incorporating trading volume into its calculation. Unlike the standard RSI, which measures the speed and change of price movements based solely on price data, the VW RSI weights its analysis by volume, emphasizing price movements backed by significant trading activity. This makes the VW RSI particularly effective for identifying bullish or bearish momentum, overbought/oversold conditions, and potential trend reversals in markets where volume plays a critical role, such as stocks, forex, and cryptocurrencies.
Key Features
Volume-Weighted Momentum Calculation:
The VW RSI calculates momentum by comparing the volume associated with upward price movements (up-volume) to the volume associated with downward price movements (down-volume).
Up-volume is the volume on bars where the closing price is higher than the previous close, while down-volume is the volume on bars where the closing price is lower than the previous close.
These volumes are smoothed over a user-defined period (default: 14 bars) using a Running Moving Average (RMA), and the VW RSI is computed using the formula:
\text{VW RSI} = 100 - \frac{100}{1 + \text{VoRS}}
where
\text{VoRS} = \frac{\text{Average Up-Volume}}{\text{Average Down-Volume}}
.
Oscillator Range and Interpretation:
The VW RSI oscillates between 0 and 100, with a centerline at 50.
Above 50: Indicates bullish volume momentum, suggesting that volume on up bars dominates, which may signal buying pressure and a potential uptrend.
Below 50: Indicates bearish volume momentum, suggesting that volume on down bars dominates, which may signal selling pressure and a potential downtrend.
Overbought/Oversold Levels: User-defined thresholds (default: 70 for overbought, 30 for oversold) help identify potential reversal points:
VW RSI > 70: Overbought, indicating a possible pullback or reversal.
VW RSI < 30: Oversold, indicating a possible bounce or reversal.
Visual Elements:
VW RSI Line: Plotted in a separate pane below the price chart, colored dynamically based on its value:
Green when above 50 (bullish momentum).
Red when below 50 (bearish momentum).
Gray when at 50 (neutral).
Centerline: A dashed line at 50, optionally displayed, serving as the neutral threshold between bullish and bearish momentum.
Overbought/Oversold Lines: Dashed lines at the user-defined overbought (default: 70) and oversold (default: 30) levels, optionally displayed, to highlight extreme conditions.
Background Coloring: The background of the VW RSI pane is shaded red when the indicator is in overbought territory and green when in oversold territory, providing a quick visual cue of potential reversal zones.
Alerts:
Built-in alerts for key events:
Bullish Momentum: Triggered when the VW RSI crosses above 50, indicating a shift to bullish volume momentum.
Bearish Momentum: Triggered when the VW RSI crosses below 50, indicating a shift to bearish volume momentum.
Overbought Condition: Triggered when the VW RSI crosses above the overbought threshold (default: 70), signaling a potential pullback.
Oversold Condition: Triggered when the VW RSI crosses below the oversold threshold (default: 30), signaling a potential bounce.
Input Parameters
VW RSI Length (default: 14): The period over which the up-volume and down-volume are smoothed to calculate the VW RSI. A longer period results in smoother signals, while a shorter period increases sensitivity.
Overbought Level (default: 70): The threshold above which the VW RSI is considered overbought, indicating a potential reversal or pullback.
Oversold Level (default: 30): The threshold below which the VW RSI is considered oversold, indicating a potential reversal or bounce.
Show Centerline (default: true): Toggles the display of the 50 centerline, which separates bullish and bearish momentum zones.
Show Overbought/Oversold Lines (default: true): Toggles the display of the overbought and oversold threshold lines.
How It Works
Volume Classification:
For each bar, the indicator determines whether the price movement is upward or downward:
If the current close is higher than the previous close, the bar’s volume is classified as up-volume.
If the current close is lower than the previous close, the bar’s volume is classified as down-volume.
If the close is unchanged, both up-volume and down-volume are set to 0 for that bar.
Smoothing:
The up-volume and down-volume are smoothed using a Running Moving Average (RMA) over the specified period (default: 14 bars) to reduce noise and provide a more stable measure of volume momentum.
VW RSI Calculation:
The Volume Relative Strength (VoRS) is calculated as the ratio of smoothed up-volume to smoothed down-volume.
The VW RSI is then computed using the standard RSI formula, but with volume data instead of price changes, resulting in a value between 0 and 100.
Visualization and Alerts:
The VW RSI is plotted with dynamic coloring to reflect its momentum direction, and optional lines are drawn for the centerline and overbought/oversold levels.
Background coloring highlights overbought and oversold conditions, and alerts notify the trader of significant crossings.
Usage
Timeframe: The VW RSI can be used on any timeframe, but it is particularly effective on intraday charts (e.g., 1-hour, 4-hour) or daily charts where volume data is reliable. Shorter timeframes may require a shorter length for increased sensitivity, while longer timeframes may benefit from a longer length for smoother signals.
Markets: Best suited for markets with significant and reliable volume data, such as stocks, forex, and cryptocurrencies. It may be less effective in markets with low or inconsistent volume, such as certain futures contracts.
Trading Strategies:
Trend Confirmation:
Use the VW RSI to confirm the direction of a trend. For example, in an uptrend, look for the VW RSI to remain above 50, indicating sustained bullish volume momentum, and consider buying on pullbacks when the VW RSI dips but stays above 50.
In a downtrend, look for the VW RSI to remain below 50, indicating sustained bearish volume momentum, and consider selling on rallies when the VW RSI rises but stays below 50.
Overbought/Oversold Conditions:
When the VW RSI crosses above 70, the market may be overbought, suggesting a potential pullback or reversal. Consider taking profits on long positions or preparing for a short entry, but confirm with price action or other indicators.
When the VW RSI crosses below 30, the market may be oversold, suggesting a potential bounce or reversal. Consider entering long positions or covering shorts, but confirm with additional signals.
Divergences:
Look for divergences between the VW RSI and price to spot potential reversals. For example, if the price makes a higher high but the VW RSI makes a lower high, this bearish divergence may signal an impending downtrend.
Conversely, if the price makes a lower low but the VW RSI makes a higher low, this bullish divergence may signal an impending uptrend.
Momentum Shifts:
A crossover above 50 can signal the start of bullish momentum, making it a potential entry point for long trades.
A crossunder below 50 can signal the start of bearish momentum, making it a potential entry point for short trades or an exit for long positions.
Example
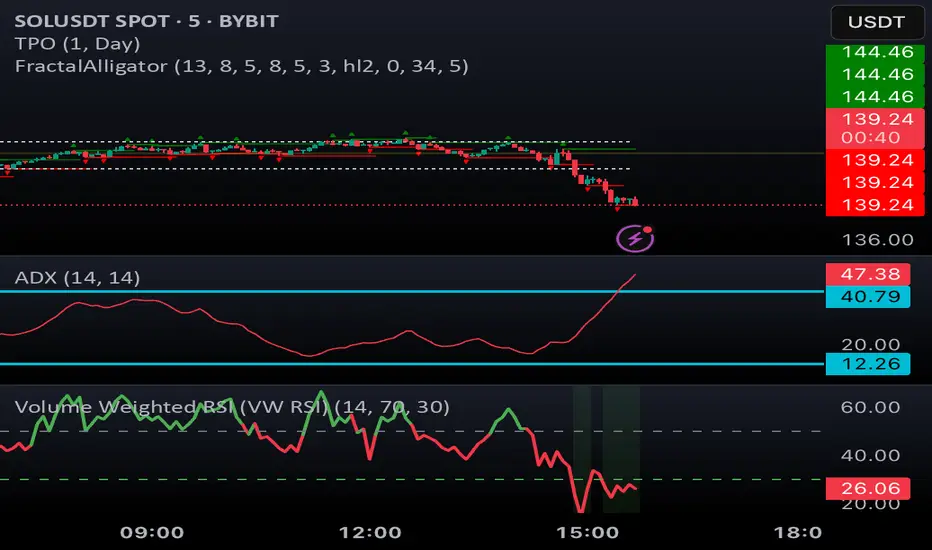
On a 4-hour SOLUSDT chart:
During an uptrend, the VW RSI might rise above 50 and stay there, confirming bullish volume momentum. If it approaches 70, it may indicate overbought conditions, as seen near a price peak of 145.08, suggesting a potential pullback.
During a downtrend, the VW RSI might fall below 50, confirming bearish volume momentum. If it drops below 30 near a price low of 141.82, it may indicate oversold conditions, suggesting a potential bounce, as seen in a slight recovery afterward.
A bullish divergence might occur if the price makes a lower low during the downtrend, but the VW RSI makes a higher low, signaling a potential reversal.
Limitations
Lagging Nature: Like the traditional RSI, the VW RSI is a lagging indicator because it relies on smoothed data (RMA). It may not react quickly to sudden price reversals, potentially missing the start of new trends.
False Signals in Ranging Markets: In choppy or ranging markets, the VW RSI may oscillate around 50, generating frequent crossovers that lead to false signals. Combining it with a trend filter (e.g., ADX) can help mitigate this.
Volume Data Dependency: The VW RSI relies on accurate volume data, which may be inconsistent or unavailable in some markets (e.g., certain forex pairs or futures contracts). In such cases, the indicator’s effectiveness may be reduced.
Overbought/Oversold in Strong Trends: During strong trends, the VW RSI can remain in overbought or oversold territory for extended periods, leading to premature exit signals. Use additional confirmation to avoid exiting too early.
Potential Improvements
Smoothing Options: Add options to use different smoothing methods (e.g., EMA, SMA) instead of RMA for the up/down volume calculations, allowing users to adjust the indicator’s responsiveness.
Divergence Detection: Include logic to detect and plot bullish/bearish divergences between the VW RSI and price, providing visual cues for potential reversals.
Customizable Colors: Allow users to customize the colors of the VW RSI line, centerline, overbought/oversold lines, and background shading.
Trend Filter: Integrate a trend strength filter (e.g., ADX > 25) to ensure signals are generated only during strong trends, reducing false signals in ranging markets.
The Volume Weighted RSI (VW RSI) is a powerful tool for traders seeking to incorporate volume into their momentum analysis, offering a unique perspective on market dynamics by emphasizing price movements backed by significant trading activity. It is best used in conjunction with other indicators and price action analysis to confirm signals and improve trading decisions.
WaveTrend, RSI, VWAP, MFI Indicator🚀 Strategy Overview
This multi-confirmation indicator combines WaveTrend, RSI, VWAP, and MFI to generate high-probability buy and sell signals with built-in risk management. It is designed for precision trading across stocks, forex, crypto, and indices.
📊 Entry Conditions
🔹 Long Entry (Buy Signal) 🟢
✅ WaveTrend crosses above the oversold level (-53)
✅ RSI is above 30 (confirming momentum shift)
✅ Price is above VWAP (bullish trend)
✅ MFI is below 20, indicating accumulation
🔹 Short Entry (Sell Signal) 🔴
✅ WaveTrend crosses below the overbought level (+53)
✅ RSI is below 70 (indicating weakness)
✅ Price is below VWAP (bearish trend)
✅ MFI is above 80, indicating distribution
📉 Exit Conditions
🔹 Take Profit (TP) 🎯
💰 Dynamic TP levels based on:
✔ ATR multiplier
✔ Percentage-based profit target
✔ Pip-based TP (for forex traders)
🔹 Stop Loss (SL) 🛑
🔸 ATR-based SL for dynamic risk management
🔸 Percentage-based SL for fixed risk strategies
🔸 Pip-based SL for forex traders
📌 Additional Features
✅ Trend Filter – Ensures trades align with market momentum
✅ ADX Confirmation – Avoids low-volatility setups
✅ Time-Based Filters – Avoids trading outside key market hours
✅ Customizable Settings – Fully adaptable to different assets & strategies
🚀 Maximize your profits with this powerful, multi-confirmation strategy! 🚀

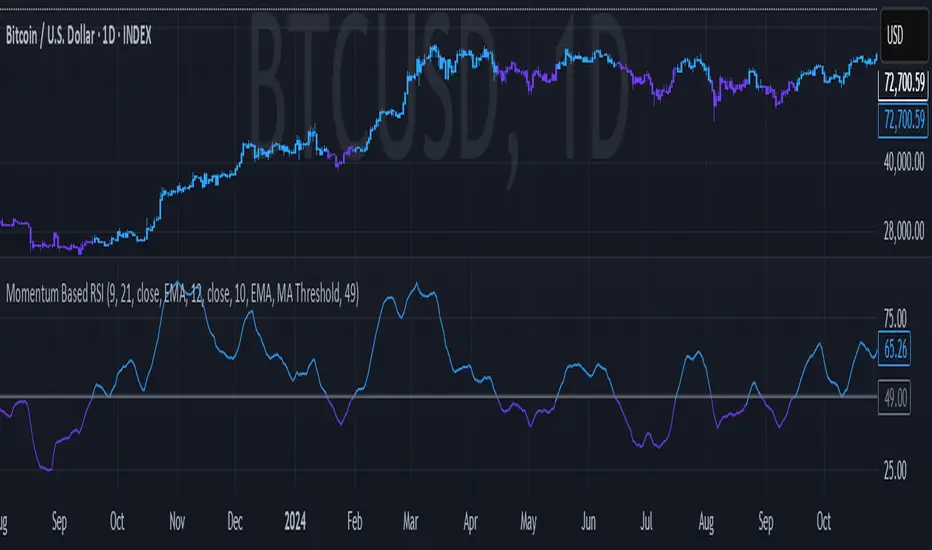
Momentum Based RSIThe Momentum Based RSI is an enhancement to the RSI. it incorporates 2 sections:
MA Ratio (Fast/Slow)
RSI
at the end both of those are multiplied to create a more responsive RSI which reacts fast to market moves while still providing a whip ressistant tool.
Momentum Calculation
The "MA Ratio" as i like to call it results from comparing 2 MAs (both can be set to whatever type you like) against eachother, which, in the end, provides a Ratio that visualizes the difference. It is simple yet effective
RSI
An Old yet popular tool which dates back to 1978. In and out of itself it is a great tool, however it still can be enhanced.
The Combination
The RSI and the MARatio are multiplied together, which results in an RSI that is ampliefied by the speed of the market movements.
This proves highly effective, since the MA Ratio is hovering around at the same level. However during trends, it picks up speed in either of both directions which marginally increases the RSI's response the said movement.
Why its Creative, New and Good
While it is a super simple concept, it still holds a lot of power relative to its sophistication. Traders may use it like they used the Vanilla RSI (e.g Trend following, Mean-reversion or other).
Unlike RSI with momentum overlays, this indicator actively uses an MA Ratio multiplier for simplicity and responsiveness.
At last, Its primary goal is to detect trends faster while not creating more noise & false signals.
What not to do
if youre using this indicator, please do NOT change the Fast MA to be slower than to Slow MA or vice versa, since you'll be getting broken & noise induced signals which may not align with your goals.
Great inventions require great Care
As with anything, you should not use this tool without any other confluence. As great as the backtests may be, you dont know what the future holds, be careful!
This indicator is not a guaranteed predicition tool. If youre going to use it for investment decisions, please use it in coherence with other tools.
Thank you for reading!
MACD, RSI, CMF, VWAP, Range Filter IndicatorThis indicator combines multiple technical analysis tools—MACD, RSI, CMF, VWAP, and a Range Filter—to generate high-probability trading signals. It identifies optimal long and short entries, applies risk management techniques, and provides trend and momentum confirmation to improve accuracy.
Key Features:
✅ Multi-Confirmation Entry Signals: Uses MACD crossovers with RSI, CMF, and VWAP for stronger buy/sell setups.
✅ Trend Filter: Applies an MA-based filter (SMA, EMA, WMA, VWMA, HMA) to confirm market direction.
✅ Momentum Filter: Uses ADX and DI+/- to validate trend strength before trade execution.
✅ Risk/Reward Visualization: Displays trade entry, stop-loss, and take-profit levels.
✅ Customizable Trading Sessions: Allows trading only during specified market hours.
✅ Day Selection Filter: Choose which weekdays to enable trading signals.
✅ Dynamic Range Filter Exit Strategy: Uses an adaptive range filter to optimize exit points.
Entry Conditions:
📌 Long Entry:
✅ MACD line crosses above the signal line.
✅ MACD value is above zero (bullish momentum).
✅ RSI Confirmation (Optional): RSI > Mid Level (50).
✅ CMF Confirmation (Optional): CMF > 0 (positive money flow).
✅ VWAP Confirmation (Optional): Price above VWAP.
📌 Short Entry:
✅ MACD line crosses below the signal line.
✅ MACD value is below zero (bearish momentum).
✅ RSI Confirmation (Optional): RSI < Mid Level (50).
✅ CMF Confirmation (Optional): CMF < 0 (negative money flow).
✅ VWAP Confirmation (Optional): Price below VWAP.
Exit Conditions:
✅ Long Exit:
✅ Price falls below the Range Filter level.
✅ RSI Exit Confirmation (Optional): RSI crosses below Overbought level (70).
✅ Short Exit:
✅ Price rises above the Range Filter level.
✅ RSI Exit Confirmation (Optional): RSI crosses above Oversold level (30).
Additional Filters:
📌 Trend Filter: Uses moving averages (SMA, EMA, WMA, VWMA, HMA) to confirm trade direction.
📌 ADX Momentum Filter: Ensures ADX is above a defined threshold for strong trend setups.
📌 Session Filter: Enables trading only within selected time periods.
📌 Day Filter: Allows users to disable trading on specific weekdays.
Best Use Cases:
✅ Scalping & Intraday Trading: Optimized for lower timeframes like 5m, 15m, 1H.
✅ Swing Trading: Works effectively on 4H & Daily charts.
✅ All Asset Types: Can be used on stocks, indices, forex, and crypto.
Customization Options:
🛠️ Adjustable MACD, RSI, CMF, VWAP settings for flexibility.
🛠️ Enable/Disable individual entry confirmations based on preference.
🛠️ Modify trend and momentum thresholds to fit different market conditions.
🚀 Optimize your trades with this powerful, multi-confirmation strategy!

Multi-Fibonacci Trend Average[FibonacciFlux]Multi-Fibonacci Trend Average (MFTA): An Institutional-Grade Trend Confluence Indicator for Discerning Market Participants
My original indicator/Strategy:
Engineered for the sophisticated demands of institutional and advanced traders, the Multi-Fibonacci Trend Average (MFTA) indicator represents a paradigm shift in technical analysis. This meticulously crafted tool is designed to furnish high-definition trend signals within the complexities of modern financial markets. Anchored in the rigorous principles of Fibonacci ratios and augmented by advanced averaging methodologies, MFTA delivers a granular perspective on trend dynamics. Its integration of Multi-Timeframe (MTF) filters provides unparalleled signal robustness, empowering strategic decision-making with a heightened degree of confidence.
MFTA indicator on BTCUSDT 15min chart with 1min RSI and MACD filters enabled. Note the refined signal generation with reduced noise.
MFTA indicator on BTCUSDT 15min chart without MTF filters. While capturing more potential trading opportunities, it also generates a higher frequency of signals, including potential false positives.
Core Innovation: Proprietary Fibonacci-Enhanced Supertrend Averaging Engine
The MFTA indicator’s core innovation lies in its proprietary implementation of Supertrend analysis, strategically fortified by Fibonacci ratios to construct a truly dynamic volatility envelope. Departing from conventional Supertrend methodologies, MFTA autonomously computes not one, but three distinct Supertrend lines. Each of these lines is uniquely parameterized by a specific Fibonacci factor: 0.618 (Weak), 1.618 (Medium/Golden Ratio), and 2.618 (Strong/Extended Fibonacci).
// Fibonacci-based factors for multiple Supertrend calculations
factor1 = input.float(0.618, 'Factor 1 (Weak/Fibonacci)', minval=0.01, step=0.01, tooltip='Factor 1 (Weak/Fibonacci)', group="Fibonacci Supertrend")
factor2 = input.float(1.618, 'Factor 2 (Medium/Golden Ratio)', minval=0.01, step=0.01, tooltip='Factor 2 (Medium/Golden Ratio)', group="Fibonacci Supertrend")
factor3 = input.float(2.618, 'Factor 3 (Strong/Extended Fib)', minval=0.01, step=0.01, tooltip='Factor 3 (Strong/Extended Fib)', group="Fibonacci Supertrend")
This multi-faceted architecture adeptly captures a spectrum of market volatility sensitivities, ensuring a comprehensive assessment of prevailing conditions. Subsequently, the indicator algorithmically synthesizes these disparate Supertrend lines through arithmetic averaging. To achieve optimal signal fidelity and mitigate inherent market noise, this composite average is further refined utilizing an Exponential Moving Average (EMA).
// Calculate average of the three supertends and a smoothed version
superlength = input.int(21, 'Smoothing Length', tooltip='Smoothing Length for Average Supertrend', group="Fibonacci Supertrend")
average_trend = (supertrend1 + supertrend2 + supertrend3) / 3
smoothed_trend = ta.ema(average_trend, superlength)
The resultant ‘Smoothed Trend’ line emerges as a remarkably responsive yet stable trend demarcation, offering demonstrably superior clarity and precision compared to singular Supertrend implementations, particularly within the turbulent dynamics of high-volatility markets.
Elevated Signal Confluence: Integrated Multi-Timeframe (MTF) Validation Suite
MFTA transcends the limitations of conventional trend indicators by incorporating an advanced suite of three independent MTF filters: RSI, MACD, and Volume. These filters function as sophisticated validation protocols, rigorously ensuring that only signals exhibiting a confluence of high-probability factors are brought to the forefront.
1. Granular Lower Timeframe RSI Momentum Filter
The Relative Strength Index (RSI) filter, computed from a user-defined lower timeframe, furnishes critical momentum-based signal validation. By meticulously monitoring RSI dynamics on an accelerated timeframe, traders gain the capacity to evaluate underlying momentum strength with precision, prior to committing to signal execution on the primary chart timeframe.
// --- Lower Timeframe RSI Filter ---
ltf_rsi_filter_enable = input.bool(false, title="Enable RSI Filter", group="MTF Filters", tooltip="Use RSI from lower timeframe as a filter")
ltf_rsi_timeframe = input.timeframe("1", title="RSI Timeframe", group="MTF Filters", tooltip="Timeframe for RSI calculation")
ltf_rsi_length = input.int(14, title="RSI Length", minval=1, group="MTF Filters", tooltip="Length for RSI calculation")
ltf_rsi_threshold = input.int(30, title="RSI Threshold", minval=0, maxval=100, group="MTF Filters", tooltip="RSI value threshold for filtering signals")
2. Convergent Lower Timeframe MACD Trend-Momentum Filter
The Moving Average Convergence Divergence (MACD) filter, also calculated on a lower timeframe basis, introduces a critical layer of trend-momentum convergence confirmation. The bullish signal configuration rigorously mandates that the MACD line be definitively positioned above the Signal line on the designated lower timeframe. This stringent condition ensures a robust indication of converging momentum that aligns synergistically with the prevailing trend identified on the primary timeframe.
// --- Lower Timeframe MACD Filter ---
ltf_macd_filter_enable = input.bool(false, title="Enable MACD Filter", group="MTF Filters", tooltip="Use MACD from lower timeframe as a filter")
ltf_macd_timeframe = input.timeframe("1", title="MACD Timeframe", group="MTF Filters", tooltip="Timeframe for MACD calculation")
ltf_macd_fast_length = input.int(12, title="MACD Fast Length", minval=1, group="MTF Filters", tooltip="Fast EMA length for MACD")
ltf_macd_slow_length = input.int(26, title="MACD Slow Length", minval=1, group="MTF Filters", tooltip="Slow EMA length for MACD")
ltf_macd_signal_length = input.int(9, title="MACD Signal Length", minval=1, group="MTF Filters", tooltip="Signal SMA length for MACD")
3. Definitive Volume Confirmation Filter
The Volume Filter functions as an indispensable arbiter of trade conviction. By establishing a dynamic volume threshold, defined as a percentage relative to the average volume over a user-specified lookback period, traders can effectively ensure that all generated signals are rigorously validated by demonstrably increased trading activity. This pivotal validation step signifies robust market participation, substantially diminishing the potential for spurious or false breakout signals.
// --- Volume Filter ---
volume_filter_enable = input.bool(false, title="Enable Volume Filter", group="MTF Filters", tooltip="Use volume level as a filter")
volume_threshold_percent = input.int(title="Volume Threshold (%)", defval=150, minval=100, group="MTF Filters", tooltip="Minimum volume percentage compared to average volume to allow signal (100% = average)")
These meticulously engineered filters operate in synergistic confluence, requiring all enabled filters to definitively satisfy their pre-defined conditions before a Buy or Sell signal is generated. This stringent multi-layered validation process drastically minimizes the incidence of false positive signals, thereby significantly enhancing entry precision and overall signal reliability.
Intuitive Visual Architecture & Actionable Intelligence
MFTA provides a demonstrably intuitive and visually rich charting environment, meticulously delineating trend direction and momentum through precisely color-coded plots:
Average Supertrend: Thin line, green/red for uptrend/downtrend, immediate directional bias.
Smoothed Supertrend: Bold line, teal/purple for uptrend/downtrend, cleaner, institutionally robust trend.
Dynamic Trend Fill: Green/red fill between Supertrends quantifies trend strength and momentum.
Adaptive Background Coloring: Light green/red background mirrors Smoothed Supertrend direction, holistic trend perspective.
Precision Buy/Sell Signals: ‘BUY’/‘SELL’ labels appear on chart when trend touch and MTF filter confluence are satisfied, facilitating high-conviction trade action.
MFTA indicator applied to BTCUSDT 4-hour chart, showcasing its effectiveness on higher timeframes. The Smoothed Length parameter is increased to 200 for enhanced smoothness on this timeframe, coupled with 1min RSI and Volume filters for signal refinement. This illustrates the indicator's adaptability across different timeframes and market conditions.
Strategic Applications for Institutional Mandates
MFTA’s sophisticated design provides distinct advantages for advanced trading operations and institutional investment mandates. Key strategic applications include:
High-Probability Trend Identification: Fibonacci-averaged Supertrend with MTF filters robustly identifies high-probability trend continuations and reversals, enhancing alpha generation.
Precision Entry/Exit Signals: Volume and momentum-filtered signals enable institutional-grade precision for optimized risk-adjusted returns.
Algorithmic Trading Integration: Clear signal logic facilitates seamless integration into automated trading systems for scalable strategy deployment.
Multi-Asset/Timeframe Versatility: Adaptable parameters ensure applicability across diverse asset classes and timeframes, catering to varied trading mandates.
Enhanced Risk Management: Superior signal fidelity from MTF filters inherently reduces false signals, supporting robust risk management protocols.
Granular Customization and Parameterized Control
MFTA offers unparalleled customization, empowering users to fine-tune parameters for precise alignment with specific trading styles and market conditions. Key adjustable parameters include:
Fibonacci Factors: Adjust Supertrend sensitivity to volatility regimes.
ATR Length: Control volatility responsiveness in Supertrend calculations.
Smoothing Length: Refine Smoothed Trend line responsiveness and noise reduction.
MTF Filter Parameters: Independently configure timeframes, lookback periods, and thresholds for RSI, MACD, and Volume filters for optimal signal filtering.
Disclaimer
MFTA is meticulously engineered for high-quality trend signals; however, no indicator guarantees profit. Market conditions are unpredictable, and trading involves substantial risk. Rigorous backtesting and forward testing across diverse datasets, alongside a comprehensive understanding of the indicator's logic, are essential before live deployment. Past performance is not indicative of future results. MFTA is for informational and analytical purposes only and is not financial or investment advice.

Custom RSI with Wilders SmoothingOnly a small modification. You can also use the Wilder-Smoothing-Average. More suitable for volatile Crypto-Token.

Crypto Futures Day Trading StrategySummary of the Strategy
Chart: 15-minute
Buy Signal:
5 SMA > 20 SMA
RSI < 70
Price not above upper BB
Sell Signal:
5 SMA < 20 SMA
RSI > 30
Price not below lower BB
Stop-Loss: 2 ATR from entry
Take-Profit: 4 ATR from entry
Risk: 1% of account per trade

RSI-Colored Price Candles with BackgroundThis Pine Script indicator visually enhances price candles based on **RSI (Relative Strength Index)** behavior, helping traders quickly assess momentum directly on the price chart.
**RSI Calculation:**
The RSI is computed using a traditional 14-period lookback. It uses `ta.rma()` to smooth average gains and losses, and then transforms the result into an RSI value between 0 and 100. This value is used to determine both **candle color** and optional **background shading**.
**Candle Coloring:**
Each price candle is recolored based on the current RSI value:
- If RSI is **greater than or equal to 50**, the candle is **bright green**, indicating bullish momentum.
- If RSI is **less than 50**, the candle is **bright red**, indicating bearish momentum.
The actual OHLC values of the candles remain unchanged. Only their color is modified to reflect RSI strength.
**Optional Background Highlighting:**
A user setting called `Show Overbought/Oversold Background` lets traders toggle background shading on or off. When enabled:
- If RSI is **above 70**, a soft **green** background appears, signaling overbought conditions.
- If RSI is **below 30**, a soft **red** background appears, signaling oversold conditions.
This provides an intuitive visual cue that highlights potential reversal or exhaustion zones based on RSI extremes.
**Custom Settings:**
- The RSI length and source are customizable.
- Background highlighting is turned **off by default**, giving users a clean chart unless they choose to enable it.
**Purpose and Use:**
This script is designed for traders who want to visually integrate RSI momentum directly into their chart candles, reducing the need to look away from price action. It's clean, responsive, and adjustable — perfect for intraday or swing traders who value simplicity backed by momentum data.

Highest High Line with Multi-Timeframe Supertrend and RSIOverview:
This powerful indicator combines three essential elements for traders:
Highest High Line – Tracks the highest price over a customizable lookback period across different timeframes.
Multi-Timeframe Supertrend – Displays Supertrend values and trend directions for multiple timeframes simultaneously.
Relative Strength Index (RSI) – Shows RSI values across different timeframes for momentum analysis.
Features:
✅ Customizable Highest High Line:
Selectable timeframes: Daily, Weekly, Monthly, Quarterly, Yearly
Adjustable lookback period
✅ Multi-Timeframe Supertrend:
Supports 1min, 5min, 10min, 15min, 30min, 1H, Daily, Weekly, Monthly, Quarterly, Yearly
ATR-based calculation with configurable ATR period and multiplier
Identifies bullish (green) & bearish (red) trends
✅ Multi-Timeframe RSI:
Calculates RSI for the same timeframes as Supertrend
Overbought (≥70) and Oversold (≤30) signals with color coding
✅ Comprehensive Table Display:
A clean, structured table in the bottom-right corner
Displays Supertrend direction, value, and RSI for all timeframes
Helps traders quickly assess trend and momentum alignment
How to Use:
Use the Highest High Line to identify key resistance zones.
Confirm trend direction with Multi-Timeframe Supertrend.
Check RSI values to avoid overbought/oversold conditions before entering trades.
Align multiple timeframes for stronger confirmation of trend shifts.
Ideal For:
✅ Scalpers (lower timeframes: 1m–30m)
✅ Swing Traders (higher timeframes: 1H–D)
✅ Position Traders (Weekly, Monthly, Quarterly)
💡 Tip: Look for Supertrend & RSI confluence across multiple timeframes for higher probability setups.

MACD + RSI + 200EMA Filtered SignalsMACD HAS RSI filter and EMA filter which gives good buy and sell signals.
Several indicators combine Moving Average Convergence Divergence (MACD) with Relative Strength Index (RSI) and Exponential Moving Average (EMA) filters to generate potential buy and sell signals . These enhanced indicators use the EMA to filter signals based on the trend, only considering buy signals when the price is above the EMA and sell signals when it's below . The RSI helps identify overbought and oversold conditions, improving the accuracy of trade entries .

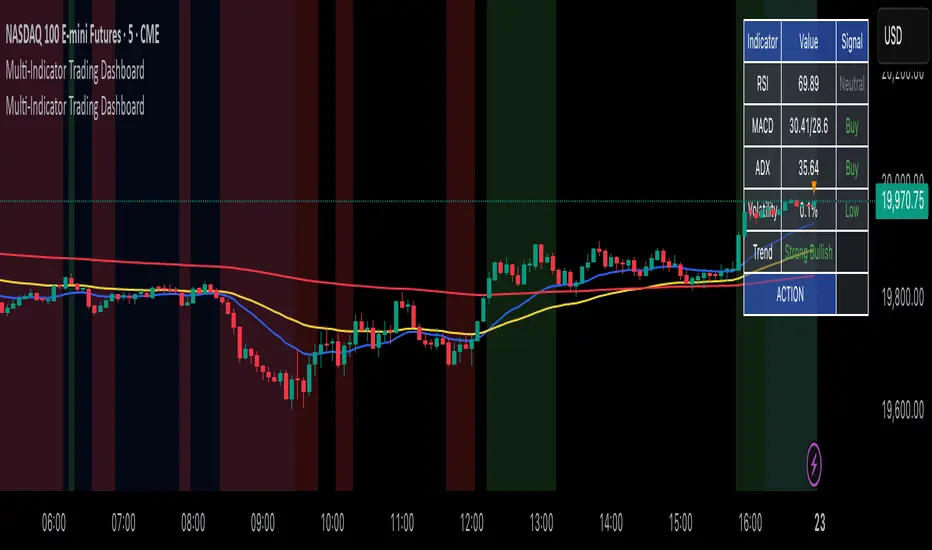
Multi-Indicator Trading DashboardMulti-Indicator Trading Dashboard: Comprehensive Analysis and Actionable Signals
This Pine Script indicator, "Multi-Indicator Trading Dashboard," provides a comprehensive overview of key market indicators and generates actionable trading signals, all presented in a clear, easy-to-read table format on your TradingView chart.
Key Features:
Real-time Indicator Analysis: The dashboard displays real-time values and signals for:
RSI (Relative Strength Index): Tracks overbought and oversold conditions.
MACD (Moving Average Convergence Divergence): Identifies trend changes and momentum.
ADX (Average Directional Index): Measures trend strength.
Volatility (ATR-based): Estimates volatility as a percentage, acting as a VIX proxy for single-symbol charts.
Trend Determination: Analyzes 20, 50, and 200-period EMAs to provide a clear trend assessment (Strong Bullish, Cautious Bullish, Cautious Bearish, Strong Bearish).
Combined Trading Signals: Integrates signals from RSI, MACD, ADX, and trend analysis to generate a combined "Buy," "Sell," or "Neutral" action signal.
User-Friendly Table Display: Presents all information in a neatly organized table, positioned at the top-right of your chart.
Visual Chart Overlays: Plots 20, 50, and 200-period EMAs directly on the chart for visual trend confirmation.
Background Color Alerts: Colors the chart's background based on the "Buy" or "Sell" action signal for quick visual cues.
Customizable Inputs: Allows you to adjust key parameters like RSI lengths, MACD settings, ADX thresholds, and EMA periods.
How It Works:
Indicator Calculations: The script calculates RSI, MACD, ADX, and a volatility proxy (ATR) using standard Pine Script functions.
Trend Analysis: It compares 20, 50, and 200-period EMAs to determine the overall trend direction.
Individual Signal Generation: It generates individual "Buy," "Sell," or "Neutral" signals based on RSI, MACD, and ADX values.
Combined Signal Logic: It combines the individual signals and trend analysis, assigning a "Buy" or "Sell" action only when at least two indicators align.
Table Display: It creates a table and populates it with the calculated values, signals, and trend information.
Chart Overlays: It plots the EMAs on the chart and colors the background based on the combined action signal.
Use Cases:
Quick Market Overview: Get a snapshot of key market indicators and trend direction at a glance.
Confirmation Tool: Use the combined signals to confirm your existing trading strategies.
Educational Purpose: Learn how different indicators interact and influence trading decisions.
Automated Alerting: Set up alerts based on the "Buy" or "Sell" action signals.
Customization:
Adjust the input parameters to fine-tune the indicator's sensitivity to your trading style and the specific market you're analyzing.
Disclaimer:
This indicator is for informational and educational purposes only and should not be considered financial advice. Always conduct thorough research and consult with 1 a qualified professional before making any 2 trading decisions.
RSI with Cross SymbolsUse to determine exits and specifically for aligning proved trendlines for swing trading

Standard Deviation SMA RSI | mad_tiger_slayerOverview of the Script
The Standard Deviation SMA RSI is a custom TradingView indicator that enhances the Relative Strength Index (RSI) by incorporating a Simple Moving Average (SMA) and Standard Deviation bands . This approach smooths RSI calculations while factoring in volatility to provide clearer trend signals . Additionally, the indicator includes overbought and oversold thresholds, trend-coded RSI signals , and dynamic volatility bands for improved market analysis. This indicator is designed for swing traders and long-term investors looking to capture high-probability trend shifts.
How Do Traders Use the Standard Deviation SMA RSI?
In the provided chart image, the indicator is displayed on a price chart. Each visual component serves a distinct function in identifying trend conditions and volatility levels .
INTENDED USES
⚠️ NOT INTENDED FOR SCALPING
With the smoothing nature of the SMA-based RSI , this indicator is not designed for low-timeframe scalping. It works best on timeframes above 1-hour , with optimal performance in 12-hour, daily, and higher timeframes.
📈 TREND-FOLLOWING & MEAN REVERSION
The Standard Deviation SMA RSI functions as both a trend-following and mean-reverting indicator:
Trend-Following: Identifies strong, sustained trends using RSI signals and SMA confirmation.
Mean Reversion: Detects overbought/oversold conditions based on standard deviation bands and RSI thresholds .
A VISUAL REPRESENTATION OF INTENDED USES
RSI Line (Green/Pink/Gray): The RSI line dynamically changes color based on trend conditions .
Green RSI → Strong uptrend, RSI above the uptrend threshold.
Pink RSI → Downtrend, RSI below the downtrend threshold.
Gray RSI → Neutral state or consolidation.
If the SMA of RSI is above Long Threshold , the market is in a bullish trend.
If it’s below Short Threshold, bearish conditions prevail.
Threshold Lines (Teal/Purple):
Green Line → Long Entry Threshold
Red Line → Short Entry Threshold
Standard Deviation Bands:
Upper Band → Measures bullish volatility expansion
Lower Band → Measures bearish volatility expansion
Colored Candles: Price candles adjust color based on RSI conditions , visually aligning price action with market trends.
Indicator's Primary Elements
Input Parameters
The script includes several configurable settings, allowing users to tailor the indicator to different market environments:
RSI Length: Controls the number of periods for RSI calculations.
SMA Length: Defines the period for the SMA applied to RSI , creating a smoothed trend line.
Standard Deviation Period: Determines the length for volatility calculations.
Overbought and Oversold Levels:
Can be adjusted to customize sensitivity.
Standard Deviation SMA RSI Calculation
The SMA-based RSI smooths fluctuations while the standard deviation bands measure price volatility.
Upper and Lower Bands: Calculated by adding/subtracting standard deviation to/from the SMA-based RSI.
Trend Signal Calculation:
RSI is compared to uptrend and downtrend thresholds to determine buy/sell conditions.
Long and Short Conditions
Buy and sell conditions are determined by RSI relative to key thresholds :
Bullish Signal: RSI above long threshold & SMA confirms trend .
Bearish Signal: RSI below short threshold & SMA confirms downtrend .
Reversals: RSI entering overbought/oversold areas suggests possible trend reversals.
Conclusion
The Standard Deviation SMA RSI is a powerful trend-following and mean-reverting tool , offering enhanced insights into RSI movements, volatility, and market strength . By combining SMA smoothing, standard deviation bands, and dynamic thresholds , traders can better identify trend confirmations, reversals, and overextended conditions .
✅ Customizable settings allow traders to optimize sensitivity.
✅ Works best on high timeframes (12H, Daily, Weekly).
✅ Ideal for swing traders and long-term investors.

RSI SignalsHanya Indicator untuk kegunaan pengguna BO System seperti saya yang scalping di US Session.
