SPY/QQQ Plan Your Trade for 5-23 : Carryover PatternLooking at the charts today, I want to say that it certainly looks like the SPY Cycle Patterns are blending into a consolidated CRUSH/BOTTOM pattern (see the weekend patterns) today and possibly "carrying over" into the early trading next week.
I have been warning of a pending rollover/breakdown in this uptrend for weeks. Today's breakdown seems a bit aggressive, but it is what it is.
If the patterns are consolidating/blending into a bigger breakdown over the Memorial Day weekend, then we could be looking at a very big downward/rotational move in the SPY/QQQ/Bitcoin over the next 5+ trading days while Gold/Silver continue to rally.
Silver is lagging Gold right now, but I don't think that lasts. Once Gold gets back above $3400, I believe Silver will start to make a big move higher.
The big question in my mind is - how does this carry into Monday's holiday trading schedule and into Tuesday's OPEN?
I'll have to see how things play out today - but it certainly looks like I'll be adding some SPREADS to potentially catch any big move over this weekend.
GET SOME.
This could play out exceptionally well for skilled traders.
#trading #research #investing #tradingalgos #tradingsignals #cycles #fibonacci #elliotwave #modelingsystems #stocks #bitcoin #btcusd #cryptos #spy #gold #nq #investing #trading #spytrading #spymarket #tradingmarket #stockmarket #silver
SPY trade ideas


Staring Down A Market Crash - $400 Target for SPY"B" waves are phonies. They are sucker plays, bull traps, speculators' paradise, orgies of odd-lotter mentality or expressions of dumb institutional complacency (or both). They often involve a focus on a narrow list of stocks, are often "unconfirmed" by other averages, are rarely technically strong, and are virtually always doomed to complete retracement by wave C. If the analyst can easily say to himself, "There is something wrong with this market," chances are it's a "B" wave.”
— The Elliott Wave Principle
In my last major idea for SPY, I predicted a bear market rally would take the price to $580 by early May. Now that we have arrived at the target, I am writing again to call for a major market reversal — a crash that will take SPY down to $400–$450 in the coming weeks. There are several factors that I am basing my assumptions on, and I will break them down briefly.
Before I do that, I would like to add to the quote above that I find B waves to be one of the most fascinating market phases. In larger degrees it is interesting to observe how sentiment changes over time and how price action can trick even seasoned traders into thinking the bear market has been vanquished, when in reality the worst lies ahead. In this instance, the collective euphoria is understandable; the trade war seems to be in retreat and inflation has remained tame. What is left to worry about? Who knows — but what I can say is that there are signs that there is still fear in the market and indices are currently at a level where they will be highly sensitive to any bad news.
Here is how I’m counting Wave (B) on the 200R ($2) chart. The price retraced to nearly 0.618 of A (0.382 level on the fib extension) and entered Wave C. I will admit that the PA in Wave C was confusing at first. As I mentioned in my previous idea, I expected the price in Wave (B) to rise to around 75% of Wave (A) and would spike above the daily 50/100/200 MAs. However, the uptrend was choppy and slow — held back by low volume and multiple traps for both sides. Fortunately, the further a trend moves along, the more clear it becomes. I am now counting Wave C of (B) as an ending diagonal, which is common in C waves.
In the diagonal, the price rose in five distinct waves once it entered the channel, with Wave (v) throwing over the top and being met with heavy resistance, which happens to be at the 1.618 extension of Wave A. While this is nearly a perfect diagonal per the rules, one issue I will point out is that Wave (iv) stopped just short of Wave (i) territory. Typically in a diagonal it should retrace into Wave (i); however, I’ll consider this to be close enough.
If the price were to move higher, the next target would be the 2.00 extension of A ($612.70). This would be near the previous ATH, which would signal a flat correction. While this is not impossible, I am going to stick with my initial instinct that the price will reverse around this level when other market indicators are taken into consideration. More on that later.
On the weekly chart, there is volume divergence and a major gap that was started this week at $570. Additionally, if Wave (B) were to end this week, it may end up with less volume than Wave (A). Since Wave (A) lasted for 8 weeks (a Fibonacci number), my box for Wave (C) is the next highest in the sequence — 13. This is just a guess, but if we were to see a similar pattern play out, AMEX:SPY should bottom out in late July or early August. The Weekly 200MA should be an important area of support, so be sure to keep an eye on that.
Also, do not forget to check the Monthly chart. Here we can see that April has a very long downside wick. I would expect to see this get filled in.
Lastly, on the daily chart, here is a recap of where we are in relation to my previous idea calling for $580 on SPY. As I predicted, the price popped above the 100MA and is finding resistance. The 100MA is ready to cross the 200MA, which can be thought of as a second death cross, if you will. I also have boxes here to show the unfilled gaps to the downside. With the trend being this exhausted, I would expect to see both get filled in soon.
Bearing all of this in mind, some people may argue that the technicals do not matter in this environment. After all, some of the headwinds that caused the first crash have dissipated and recession fears seem to be waning. While I won’t argue against any of that, there are other signs that the market is not out of the woods yet. Looking beyond SPY, TVC:US10Y has been on the rise and is on track to make a higher high. I’m targeting 5% over the coming weeks. I have another idea that looks more closely into this so I won’t elaborate any further in this post; however, this is one sign that institutions are risk-averse when it comes to the US economy.
The other component of this assessment is that the dollar appears to be heading lower. The chart above is inverted to more easily show what appears to be a classic impulse wave structure entering Wave 5, which could take TVC:DXY to the 1.618 extension of Wave 1 — around $96.68. If this were to play out, the dollar index would reach its lowest level since March 2022. This could spur a debt crisis where the Fed will have to make difficult decisions. If they start cutting rates to lower yields, it could also add further downside pressure to the dollar, which could make finding the right balance difficult. Keeping rates higher for longer and buying back Treasuries would be the preferred route, but Powell could face mounting political pressure to start making cuts if it seems the situation is getting out of hand, and could lead to more trouble down the road. This strain could be a possible fundamental backing for a stock market sell-off, so it is important to pay attention to.
Lastly, the final signs that indicate to me that a reversal is coming soon is that this uptrend is losing breadth. This is evident when looking at indices that are not weighted so heavily by mega cap tech stocks, such as TVC:DJI and $RUT. It was striking to see AMEX:DIA and AMEX:IWM down Tuesday and Wednesday while AMEX:SPY and NASDAQ:QQQ inched higher. On AMEX:DIA , the 100MA is starting to cross the 200MA and volume is picking up. Once tech starts selling off, we will see the other major indexes tumble.
I could keep going on and on, but you get the point. Here is TVC:VIX at a critical support level and starting to reverse higher. One last comment on B waves is that it is dangerous to follow the herd during times like these. Trust the technicals, and when something seems off — trust your instincts. We will never know what news is around the corner, but financial markets are so vast that we should assume that all factors known and unknown to the general public are being priced in real time.
As the next phase of the downtrend gets going, it will be easier to predict the bottom with greater accuracy. For now, I’m keeping the range wide and will look for $400–$450. As always, thank you for reading and let me know what you think.


SPY | Liquidity Engineering or Reversal?🕰️ Daily Chart | May 21, 2025
🏢 Posted by: Wavervanir_International_LLC
“Major buyers are lurking... but will the market deliver the fill they want?” That’s the question.
We’re currently watching a tactical rejection near 598.22, the 0.886 Fib retracement of the prior high-volume breakdown. This level historically serves as a liquidity sweep zone before decision-making candles emerge.
🔍 Technical + Volume Profile:
Liquidity Zones:
Resistance: 594.4–598.2 = prior supply + Fib confluence
Demand Zones:
567.5 → anchored VWAP / trend channel midpoint
559.3 → 0.618 Fib + major positioning cluster
Volume: Distribution volume into prior highs = possible short-term exhaustion
EMA Structure: Bullish stack but extended from mean; room for reversion to VWAP bands.
🧠 Macro Overlay:
Risk Events: Debt ceiling headlines are muted, but upcoming PCE inflation and labor data could dictate short-term gamma positioning.
Options Skew: OTM put volume rising; VIX curve remains steep in front-end → suggesting hedging or prep for pullback.
Macro Setup: Real yields are sticky, and the Fed is not signaling dovish pivot yet — any continuation will need confirmation via breadth and credit spreads.
🛡️ Risk Framework:
Reclaim 598.2: Bias flips bullish with upside into 613–644
Break Below 567.5: Opens doors for deeper retest at 559 or even 533
Neutral Range: 567.5–594.5 → Let market structure show intent before deploying size.
📌 Game Plan:
Let price come to you. Patience > Prediction. Market is deciding whether to reward early breakout traders or punish late longs via mean reversion. Watch the 567–559 cluster—that’s where smart money may reload.
—
🔗 #SPY #MacroTrading #VolumeAnalysis #RiskManagement #Fibonacci #Wavervanir #SP500 #LiquidityMap

SPY Will Keep Growing! Buy!
Hello,Traders!
SPY is trading in an uptrend
And the index made a retest
Of the key horizontal level
Of 579$ from where we are
Already seeing a bullish
Rebound so as we are
Bullish biased we will be
Expecting a further
Bullish move up
Buy!
Comment and subscribe to help us grow!
Check out other forecasts below too!
Disclosure: I am part of Trade Nation's Influencer program and receive a monthly fee for using their TradingView charts in my analysis.

$SPY Daily Chart Taz Plan - May 2025 into June-July Breakdown📉 SPY Daily Chart Trading Plan — May 2025
Thesis:
Price has returned to the exact level ($594.20) where the February impulse breakdown began. This zone is acting as a Lower High rejection within a broader bearish structure. A clean rejection here opens the door to multiple inefficiency fills below.
🔍 Structure Breakdown:
Feb High (ATH): $613.23
Feb Open: $592.67
Feb Close (last green candle before impulse): $594.20
Current Price: $594.20
Marked LH: $592.50
This is a rally back into rejection, not strength.
📉 Key Zones & Gaps:
🔺 Gap Supply: $566.48 – $578.50
🔺 Wick Gap: $558 – $566 → Needs a full-body candle to initiate fill
🟥 FVG (4/22): $528 – $541.52
🧱 Major Support: $481.80
🧠 Trade Plan:
Short Entry 1 (Confirmation-Based):
🔻 Red candle rejection under $592.50 = starter short
🔻 Watch RSI and MACD for momentum fade
Short Entry 2 (Gap Breach):
🔻 If $578 is broken and retested → scale in
🔻 Gap fill expected quickly once triggered
Short Entry 3 (Wick Gap):
🔻 Body close through $558 = last add
🔻 Sets up for final flush to FVG
🎯 Targets:
$578.50 → $566.48 (Gap Fill)
$558 → $541.52 (Wick Gap & FVG Top)
$528 – $530 (FVG Close)
$481.80 (Long-Term Panic Target)
❌ Invalidation:
Daily close > $595.50 = Pause thesis
Weekly close > $600 = Structural shift, short squeeze zone
🧠 Final Thoughts:
This isn’t just a gap fill play — it’s a structural fade from a lower high back into memory. The Feb impulse wave left behind layers of inefficiency, and price just tapped the origin of the breakdown.
Momentum is peaking. If this is a trap, the downside should begin immediately.
Let the chart prove it.


Big Wick Month in Classic Bear MoveWhich type of move we're in is hard to determine at this point, but if we were inside a classic bull trap we'd have to trade down to 5500 - 5400 from this zone.
It'd have to be a wick rejection on the monthly candle.
Which would mean we'd have to dump over 7% in the next 10 days.
These things may or may not happen, but the odds betting on them are awesome.

SPY/QQQ Plan Your Trade EOD Update : Memorial Weekend RisksThis EOD update is to help you try to position for the risks associated with a further breakdown in price trends over the lone Memorial Day weekend.
I know this video will be posted late in the day - but I want you to learn how to hedge against risks and try to learn to take your profits when they are THERE.
This is a really quick video.
Stay safe this weekend and thank you to all our VETS for your service and sacrifices.
We honor you this weekend.
GET SOME.
#trading #research #investing #tradingalgos #tradingsignals #cycles #fibonacci #elliotwave #modelingsystems #stocks #bitcoin #btcusd #cryptos #spy #gold #nq #investing #trading #spytrading #spymarket #tradingmarket #stockmarket #silver

SPY/QQQ Plan Your Trade For 5-19 : Gap Breakaway In Trend ModeToday's pattern suggests the SPY/QQQ will start with an opening price GAP (downward in this case) and could continue to move into a Breakaway pattern.
Given the recent news of a US Credit Downgrade, I'm suggesting all traders prepare for what may become a period of sideways price volatility over the next 3-5+ days.
I've highlighted a potential breakdown range on the SPY/QQQ on my charts that I believe acts as a solid confirmation level related to any potential reversal/breakdown in trend.
Currently, the trend is still BULLISH. If price falls below my breakdown range (the angled rectangle on my charts) - then I believe price will have broken this upward FLAGGING trend channel and will begin to move downward - targeting lower support levels.
This is a critical time for the markets. If we fail to move higher at these levels, we have a long way to go (downward) before we attempt to find any support.
Gold and Silver appear to be attempting to break the FLAG HIGH of an Inverted Excess Phase Peak pattern. This could prompt a strong rally phase back above $3300/$33 for Gold/Silver over the next few days. Time will tell how things play out.
BTCUSD appears to be REJECTING the recent highs within a consolidation range. If this rejection continues, I see BTCUSD moving downward - trying to reach the $95k (or lower) looking for support.
Remember, we are still generally BULLISH and moving upward within the FLAGGING channel. If we do get a breakdown in price over the next few days, it will become clearly evident on the charts and we'll have to begin to change our expectations.
Right now - HEDGE.
Get Some...
#trading #research #investing #tradingalgos #tradingsignals #cycles #fibonacci #elliotwave #modelingsystems #stocks #bitcoin #btcusd #cryptos #spy #gold #nq #investing #trading #spytrading #spymarket #tradingmarket #stockmarket #silver

SPY or SPX vs 3 month Treasury yieldLets just few the picture and let it tell us a 1000 words.
Everyone says to the moon...Just like 2009, up we go....Just like 2020, up we go
But let us view it another way...eh?
You "stole/froze" whatever you label it...Russian Assets and kicked them from Swift, which they return the favor by arguing that the ceasefire deal cant be done cause they don't like the style of pen you brought that day....
You decided to show the the world that you will turn a certain area of the Mediterranean into a French Plaza with beach front hotels, and may...maybe give the inhabitants vouchers to move away- one can say its a booming deal for them.
You decide to demonstrate to the world that on a tweet's notice you will change policy without official announcements and policy update for the rest of the world.
Then you decide...well I think that picture is becoming clear- Japan just bit the hand of Uncle Sam and said 'if you step any closer the treasuries get it'
So in all, the rally to ATH is literally exactly like 2009 and 2020, since there is literally nothing that has changed and everything above was equally going on, just change the dates and the people/places involved but exactly the same right.
Except for that weird number 0...0% which seemed to occur in 2009 and 2020- no coincidence there and todays 4.3% means absolutely nothing...just slight inflation, roughly 12-13k % increase...but its no issue.
So what can we surmise here....:
Well you were dropping for a good amount of time in 2009- ~504 days and in 2020 you basically turned the lights off and then on again...so that seems to fit with what just happened here right>>
you had 282 days of drop in 2022, which is 56% of 2009 and you literally made up a number of tariffs, then made up a lower number a month later and bingo-bango back up you go....
butttt...one of these things in pink just doesn't quite fit...so honestly it will be a delight to see how the see-saw theory works:
I call it a theory cause there is no proof on the chart that when the market goes up- yields go up, no case for it and not visible on the chart anywhere....So we should be good. Ergo....
As the market makes ATH and keeps charging up, the yields will go back down to 0% or so on the 3month and stay there cause that follows the see-saw theory. You don't keep money in the markets for too long as they rise, you rotate it into the treasuries cause you get a better stable return.
So...Trump and Bessent win...getting lower yields and a higher stock market- cause just look at the Technical Analysis everyone- there is only emotion in people saying Yields go up as the S&P goes up, its not cold hard logical facts right...only emotional people think stocks make yields go up..jeez
----
If you agree with the last bit there...you may need to check your local big city, over 2-3million inhabitants, to see how you are doing in these ATH markets....you may find that when treasuries are up....you arent doing so well on the street..
You can lie to a Tiger and say according to the charts you are more advanced than him and you will, according to the charts, beat him due to your superiority. He however lives in reality and wonders why you are talking to him and showing him a paper- so he offs you and walks away- feeling nothing cause you were the emotional one trying to use a chart to tell nature what it isn't. :)
be careful out there...cause V-bottom explosions need a 0 or close to 0% interest rate...and 4.3 isn't 0, so study an elliot wave guy and see if this isnt what is called the "B-wave" where you may settle back in the 400 range soon..and low 400 at that.


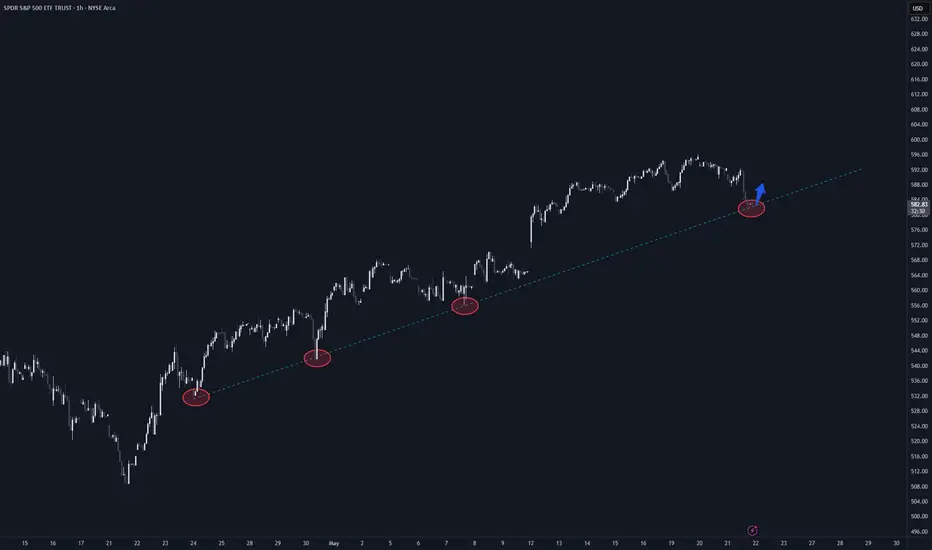
Rising wedge on SPY - Melt up? or Next leg down? Immediate Bias (Tomorrow):
Scenario 1 – Bullish Continuation (Low Probability unless there's a macro catalyst):
Breaks above ~$596–$598 cleanly
Retests that zone as support (watch 595.50 intraday)
Then targets:
600 psychological
604–608 upper resistance channel
Possible end-of-month blow-off top: 612–618
Scenario 2 – Pullback / Rejection (More Probable Setup):
Rejected at ~596–597 zone (which aligns with upper wedge resistance)
Breakdown below $590 intraday
Then targets:
587.80 EMA cluster (20/50)
If lost → 576.44 next EMA + demand level
Followed by major support at 565.87 / 563.43
🔥 Week Ahead Trade Plan (May 20–24)
✅ Bullish Possibility:
If NVDA earnings, FOMC minutes, or macro data surprise to the upside
Watch for breakout above the red wedge and hold above 600
Target range: 604 → 612 max upside
🚨 Bearish Scenario:
Wedge breakdown below ~$590
Momentum cracks down to:
587
576 (watch for bounce)
If panic selling → 565–563 (larger time frame buying zone)
Volume divergence and overbought EMAs support a potential cool-off.
📅 Monthly Projection (End of May):
If wedge breaks down → consolidation range between 563 – 587
If wedge breaks out → blow-off rally up to 612–620, but likely to fade quickly
Fed commentary and NVDA earnings on May 22 will be major catalysts
📌 Key Levels
Type Price Notes
Resistance (R3) 612–618 Final upside blow-off zone (channel top)
Resistance (R2) 604 Overhead channel line
Resistance (R1) 595–598 Wedge top + major resistance
Support (S1) 587 EMA cluster + strong local demand
Support (S2) 576 Clean structure + prior breakout
Support (S3) 565–563 Confluence of long-term EMAs + trendline
🎯 Trade Setups
📉 Bearish (Favored if no breakout tomorrow):
Short 595–597 with stop above 600
Targets: 587 → 576
Optional: Add below wedge break (~590)
📈 Bullish (Confirmation-based):
Break + retest of 597–600
Target: 604, then scale out at 612
Avoid front-running long unless you see volume + price close outside wedge

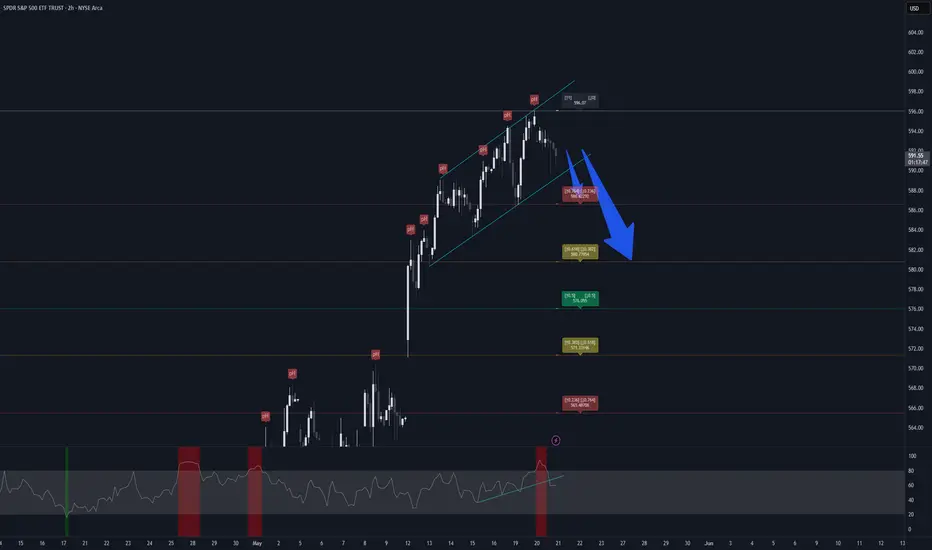

SPY SHORTES Futures have decisively broken down from the ascending wedge pattern that had been forming over the past few weeks. This bearish technical breakdown suggests a potential shift in market sentiment and momentum. Given the high correlation, I'm anticipating that SPY will follow suit shortly, especially as macroeconomic pressures intensify.
The catalyst appears to be a combination of bearish fundamental developments:
Moody’s Credit Downgrade: The recent downgrade has shaken investor confidence in U.S. creditworthiness, adding fuel to the bond market selloff.
Bond Market Pressure: Yields continue to climb as investors exit fixed income, concerned about rising inflation, mounting debt, and tightening financial conditions.
Fiscal Uncertainty: The U.S. House has passed Trump’s substantial tax bill, which, while aimed at stimulating growth, raises concerns about further ballooning the national deficit. This is compounded by Trump's new spending package and a proposed debt ceiling increase, heightening fiscal instability and long-term debt fears.
We’re also seeing an uptick in volume following the last downward wave, which may indicate institutional participation and confirmation of the breakdown.
Technical Targets (If Breakdown Continues):
nPoC (Naked Point of Control): A high-probability magnet for price action due to untested liquidity.
50% Fibonacci Extension: Suggests a measured move target based on the size of the previous wave.
0.618 Fibonacci Retracement (Golden Pocket): A key confluence zone that often acts as strong support/resistance due to its high relevance in market algorithms and trader psychology.
These targets present a strong technical confluence zone and may serve as areas of interest for both short covering and potential long re-entries.

SPY | RANGE TRADE | Dark Pool Activity | (May 19, 2025)SPY | RANGE TRADE | Dark Pool Activity + Structural Shift | (May 19, 2025)
1️⃣ Insight Summary:
SPX is still trading near a key sell zone, and recent dark pool activity suggests a possible shift in market structure. A correction from here wouldn’t be surprising.
2️⃣ Trade Parameters:
Bias: Neutral with Short Bias
Entry Zone: Watching current highs as a potential area to fade
Stop Loss: Above recent highs (tight and reactive)
TP1/TP2: Targeting lower support zones if correction unfolds
Alternative Setup: If support holds and structure flips, I may look for reactive longs
3️⃣ Key Notes:
✅ Notable dark pool prints showed up on Thursday, indicating potential distribution — this has changed how I view the market structure
✅ I’m preparing for a “sell the highs, buy the lows” scenario inside the current range
❌ A clean breakout above the current resistance zone would invalidate the short bias
💡 I’ve outlined both long and short scenarios — it's all about reacting to what price gives us
4️⃣ Follow-up Note:
If things start moving sharply, I’ll post an update with chart visuals and refined zones. Also, let me know if you'd like my dual-path trade planning template — it’s great for these types of setups.
Please LIKE 👍, FOLLOW ✅, SHARE 🙌 and COMMENT ✍ if you enjoy this idea! Also share your ideas and charts in the comments section below! This is best way to keep it relevant, support us, keep the content here free and allow the idea to reach as many people as possible.
Disclaimer: This is not a financial advise. Always conduct your own research. This content may include enhancements made using AI.

SPY Trading Opportunity! SELL!
My dear subscribers,
My technical analysis for SPY is below:
The price is coiling around a solid key level - 594.29
Bias - Bearish
Technical Indicators: Pivot Points Low anticipates a potential price reversal.
Super trend shows a clear sell, giving a perfect indicators' convergence.
Goal - 563.56
My Stop Loss - 611.99
About Used Indicators:
By the very nature of the supertrend indicator, it offers firm support and resistance levels for traders to enter and exit trades. Additionally, it also provides signals for setting stop losses
Disclosure: I am part of Trade Nation's Influencer program and receive a monthly fee for using their TradingView charts in my analysis.
———————————
WISH YOU ALL LUCK

S&P500 2022 into the Bear Market. Same Pattern 2025In 2022, before the bear market began, we saw the same pattern that we're seeing now:
1. Sine wave pattern
2. Fake recovery
3. Break above the sine wave top
4. Sharp decline
Last week, right after the sine wave top was broken, U.S. bonds were downgraded AFTER OFFICIAL MARKET SESSION!
It’s no surprise that rating agencies are losing confidence in the U.S. government's ability to repay its debts.
Just look at the rising interest payments — if that’s not a wake-up call, I don’t know what is. 😕
I don’t live in the U.S., but I’m genuinely concerned that a collapse — which now seems nearly inevitable — will impact the entire world.
Going long in U.S. markets under these technical and fundamental conditions? Putting all your eggs back into that basket? Really?
I hope this gives some perspective.
Trade safely, trade small, and keep your risks minimal.


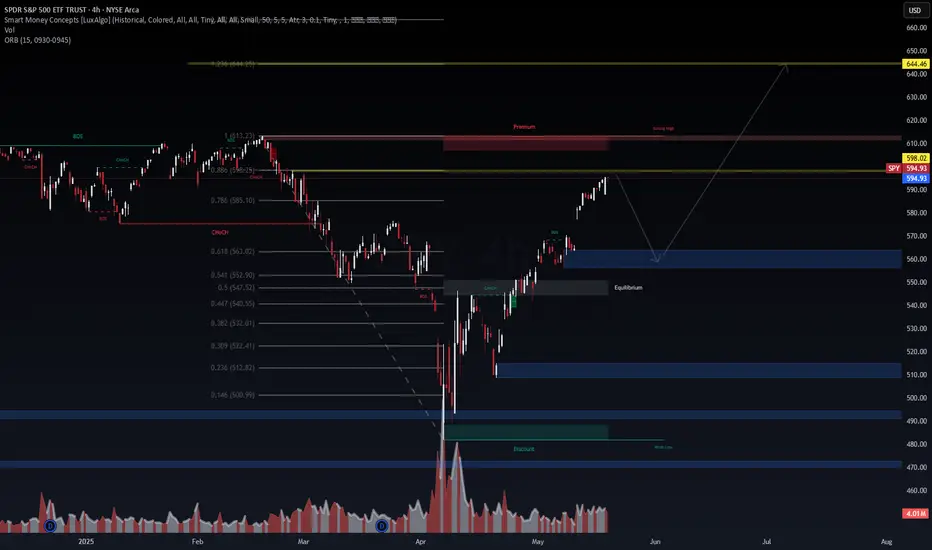
SPY 4H | Smart Money Concepts x Fibonacci ConfluencePrice has rallied into premium territory (above the 0.786–0.886 Fibonacci retracement), tapping into a prior strong high with signs of exhaustion. From a Smart Money perspective, we're entering a high-probability sell-side liquidity sweep zone. 📉
Key Technical Highlights:
🔺 Strong High @ ~613.23 aligning with FVG and premium zone
🔻 Projected retracement target: 560–565 zone (mid-FVG & equilibrium)
⚖️ Equilibrium at ~563 — likely acting as magnet for price
🟦 Demand zone and breaker block overlap between 560–570
📈 Long-term bullish trajectory remains intact if this corrective leg plays out and holds
Bias:
Short-term Bearish: Potential rejection from premium into equilibrium
Mid-term Bullish: If we reclaim the demand zone with strength, we likely re-accumulate and target the ultimate liquidity grab @ 644.46
"Liquidity seeks liquidity. Patience is premium." – Wavervanir DSS
📍Watch for volume confirmation and reaction near 560–570 before scaling in. If invalidated (close above 613), reevaluate bullish breakout scenario.
#SPY #SmartMoney #Fibonacci #Wavervanir #Liquidity #VolumeProfile #OrderBlocks #TradingView #QuantStrategy #PriceAction #SMC