Bombay Dyeing - Bullish shark formationBombay dyeing has completed Bullish shark formation and it has potential for following targets;
Target1: 200 (Weekly candle close above 201 will have following potential)
215 / 232 / 287 / 325
23.75 INR
4.90 B INR
16.05 B INR
90.20 M
About BOMBAY DYEING & MFG. CO L
Sector
Industry
Website
Headquarters
Mumbai
Founded
1879
ISIN
INE032A01023
FIGI
BBG000BMYRR2
The Bombay Dyeing & Manufacturing Co. Ltd. engages in the manufacturing and sale of textile and polyester. It operates through the following segments: Real Estate, Polyester, and Retail or Textile. The Real Estate segment includes residential, commercial, and retail real estate projects. The Polyester segment offers polyester staple fiber, which is used as a substitute for cotton to manufacture yarn. The Retail or Textile segment manufactures cotton textile, non-woven fabrics, and dimethyl terephthalate. The company was founded by Nowrosjee Wadia on August 23, 1879 and is headquartered in Mumbai, India.
3%
29%
55%
81%
107%
Q4 '23
Q1 '24
Q2 '24
Q3 '24
Q4 '24
0.00
1.20 B
2.40 B
3.60 B
4.80 B
Revenue
Net income
Net margin %
Revenue
COGS
Gross profit
Op expenses
Op income
Non-Op income/ expenses
Taxes & Other
Net income
−1.20 B
0.00
1.20 B
2.40 B
3.60 B
Revenue
COGS
Gross profit
Expenses & adjustments
Net income
0.00
900.00 M
1.80 B
2.70 B
3.60 B
No news here
Looks like there's nothing to report right now

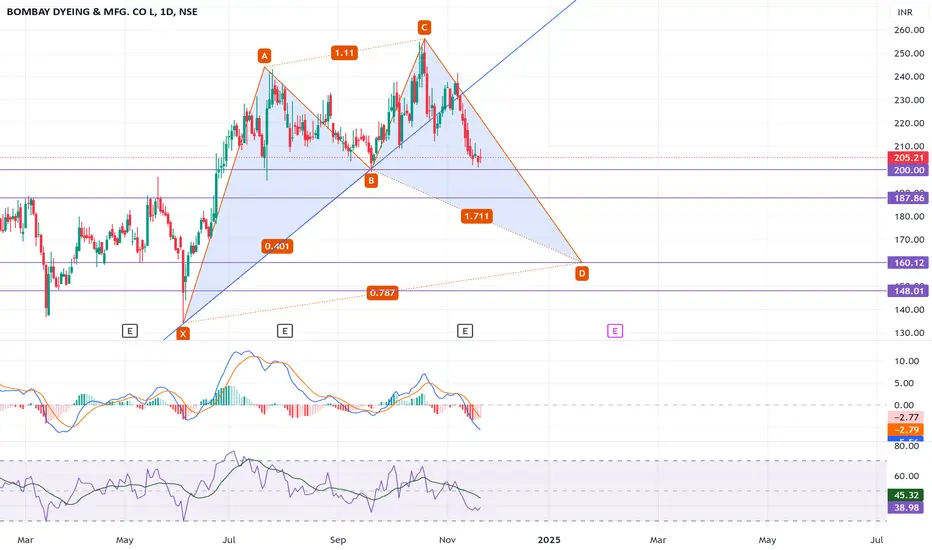
Bombay Dyeing 160/150 possible if broken 200 support on week TFBombay Dyeing has weak MACD and RSI indicator
It is forming Cypher M pattern as it has candles below lakshman rekha line.
Now it has major support at 200, if it close below 200 on weekly time frame then following targets possible.
Target 190/ 170/ 160/150
BOMBAY DYEING - Ready to Move to the Next OrbitThe stock after facing price rejection in the range of 224 to 241 was pushed down to the 50 DMA. It moved almost sideways in the last three months. Recently we saw some interest coming back into the stock with the relative strength and the money flow turning positive and the volume was also increasi


BOMBAY DYEING & MFG S/R for 25/6/24Support and Resistance Levels: In technical analysis, support and resistance levels are significant price levels where buying or selling interest tends to be strong. They are identified based on previous price levels where the price has shown a tendency to reverse or find support.
Support levels ar

bombay dyiengEstablished by Nowrosjee Wadia in 1879 as a small operation of Indian spun cotton yarn dip dyed by hand, Bombay Dyeing has now grown to be one of the most respected and trusted brands in the country.
Since the first store in 1879 and the only store manager, the growth has not only been in the compa

Buy Entry for Bombay DyeingAs per the SMC concept, the market needs more liquidity to break the Previous HIgh. Liquidity means the price should break the previous low,
In simple words, the market needs inducement to fuel the volume. In this chart, the price breaks the previous low and also sweeps liquidity. Now the market


See all ideas
Summarizing what the indicators are suggesting.
Oscillators
Neutral
SellBuy
Strong sellStrong buy
Strong sellSellNeutralBuyStrong buy
Oscillators
Neutral
SellBuy
Strong sellStrong buy
Strong sellSellNeutralBuyStrong buy
Summary
Neutral
SellBuy
Strong sellStrong buy
Strong sellSellNeutralBuyStrong buy
Summary
Neutral
SellBuy
Strong sellStrong buy
Strong sellSellNeutralBuyStrong buy
Summary
Neutral
SellBuy
Strong sellStrong buy
Strong sellSellNeutralBuyStrong buy
Moving Averages
Neutral
SellBuy
Strong sellStrong buy
Strong sellSellNeutralBuyStrong buy
Moving Averages
Neutral
SellBuy
Strong sellStrong buy
Strong sellSellNeutralBuyStrong buy
Displays a symbol's price movements over previous years to identify recurring trends.
Frequently Asked Questions
The current price of BOMDYEING is 154.55 INR — it has increased by 2.11% in the past 24 hours. Watch BOMBAY DYEING & MFG.CO.LTD. stock price performance more closely on the chart.
Depending on the exchange, the stock ticker may vary. For instance, on BSE exchange BOMBAY DYEING & MFG.CO.LTD. stocks are traded under the ticker BOMDYEING.
BOMDYEING stock has risen by 4.99% compared to the previous week, the month change is a 16.20% rise, over the last year BOMBAY DYEING & MFG.CO.LTD. has showed a −12.21% decrease.
BOMDYEING reached its all-time high on May 9, 2018 with the price of 321.60 INR, and its all-time low was 6.00 INR and was reached on Apr 28, 1999. View more price dynamics on BOMDYEING chart.
See other stocks reaching their highest and lowest prices.
See other stocks reaching their highest and lowest prices.
BOMDYEING stock is 4.42% volatile and has beta coefficient of 1.84. Track BOMBAY DYEING & MFG.CO.LTD. stock price on the chart and check out the list of the most volatile stocks — is BOMBAY DYEING & MFG.CO.LTD. there?
Today BOMBAY DYEING & MFG.CO.LTD. has the market capitalization of 31.26 B, it has increased by 4.21% over the last week.
Yes, you can track BOMBAY DYEING & MFG.CO.LTD. financials in yearly and quarterly reports right on TradingView.
BOMDYEING net income for the last quarter is 115.40 M INR, while the quarter before that showed 700.60 M INR of net income which accounts for −83.53% change. Track more BOMBAY DYEING & MFG.CO.LTD. financial stats to get the full picture.
Yes, BOMDYEING dividends are paid annually. The last dividend per share was 1.20 INR. As of today, Dividend Yield (TTM)% is 0.79%. Tracking BOMBAY DYEING & MFG.CO.LTD. dividends might help you take more informed decisions.
BOMBAY DYEING & MFG.CO.LTD. dividend yield was 0.92% in 2024, and payout ratio reached 5.06%. The year before the numbers were 0.75% and 0.84% correspondingly. See high-dividend stocks and find more opportunities for your portfolio.
EBITDA measures a company's operating performance, its growth signifies an improvement in the efficiency of a company. BOMBAY DYEING & MFG.CO.LTD. EBITDA is −268.00 M INR, and current EBITDA margin is −1.67%. See more stats in BOMBAY DYEING & MFG.CO.LTD. financial statements.
Like other stocks, BOMDYEING shares are traded on stock exchanges, e.g. Nasdaq, Nyse, Euronext, and the easiest way to buy them is through an online stock broker. To do this, you need to open an account and follow a broker's procedures, then start trading. You can trade BOMBAY DYEING & MFG.CO.LTD. stock right from TradingView charts — choose your broker and connect to your account.
Investing in stocks requires a comprehensive research: you should carefully study all the available data, e.g. company's financials, related news, and its technical analysis. So BOMBAY DYEING & MFG.CO.LTD. technincal analysis shows the buy rating today, and its 1 week rating is neutral. Since market conditions are prone to changes, it's worth looking a bit further into the future — according to the 1 month rating BOMBAY DYEING & MFG.CO.LTD. stock shows the buy signal. See more of BOMBAY DYEING & MFG.CO.LTD. technicals for a more comprehensive analysis.
If you're still not sure, try looking for inspiration in our curated watchlists.
If you're still not sure, try looking for inspiration in our curated watchlists.