RUSSELL 2000 STILL IN BUY ZONE!Hey Traders so here we can see that it's building support levels and holding. So imo this is a bullish sign if Nasdaq 100 continues to rise I think it should push Russell higher as Nasdaq normally leads the market.
So if you are bullish make sure you put your stop below a good support level.
If be
E-Mini Russell 2000 Index Futures
2,191.1USDD
+3.5+0.16%
As of today at 08:42 GMT
USD
No trades
No news here
Looks like there's nothing to report right now

28% Profits Possible for Small CapsIt appears that small caps (and major large-cap stocks) are at a crucial point currently. The price breaking out of the bump-and-run pattern to the upside, combined with a neutral Fear and Greed Index, suggests a potential continuation of the bull run. The target is approximately $2,750, regardless

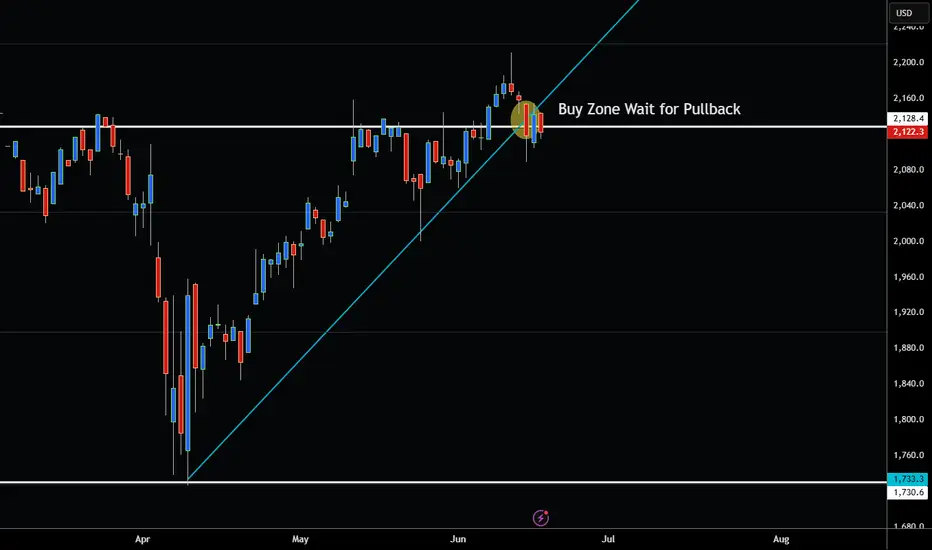
RUSSELL 2000 PULLS BACK TO TRENDLINE SUPPORT ZONE WATCHING! Hey Traders so today continuing previous chart on Russell 2000 so as you can see markets always do eventually pull back most of the time.
So what now?
Well support at 2127 seems to want to hold. FED meeting tommorow of course could change that.
Always expect the unxepected in trading!
I am bu
Russell 2000 Breaks Above 50% Fibonacci Retracement Level!Hey Traders today was checking out the Russell 2000 again and it's bullish momentum is increasing fast.
But it's looking a little overbought now and so are the other indexes it's been an nice leg up so far and Im not saying it can't continue but remember what goes up must come down eventually. In


Russell Leads Equities HigherEquity markets saw a positive day today with the Russell leading the way higher being up over 1.5% on the session. For the S&P and Nasdaq, this was the third session in a row with a higher high, and the 200-day moving average has acted as a floor in these markets since the breakout higher on May 12t

Russell 2000 at Important Resistance Level Hey Traders so today if we take a look at the Russell 2000 it is now at a very important resistance level 2105.
The reason this level is important imo is because it is also the 50 % Fibonacci Retracement Level from last years high. Markets normally retrace 50% of the last big move which it has n


RUT RTY1! IWM: Trade⚠️ Short Bias on RTYM (E-Mini Russell 2000 Futures)
Price has rejected the premium zone with clear BOS and CHoCH formations, suggesting distribution. Currently sitting below EMA clusters with weak bullish follow-through.
Volume confirms distribution. Targeting the equilibrium zone (1981.1) as next


See all ideas
Summarizing what the indicators are suggesting.
Neutral
SellBuy
Strong sellStrong buy
Strong sellSellNeutralBuyStrong buy
Neutral
SellBuy
Strong sellStrong buy
Strong sellSellNeutralBuyStrong buy
Neutral
SellBuy
Strong sellStrong buy
Strong sellSellNeutralBuyStrong buy
A representation of what an asset is worth today and what the market thinks it will be worth in the future.
Displays a symbol's price movements over previous years to identify recurring trends.
RTYM2025
Jun 2025DMarket closed
2,128.9USD+0.73%
RTYU2025
Sep 2025DMarket open
2,191.1USD+0.16%
RTYZ2025
Dec 2025DMarket open
2,210.9USD+0.33%
RTYH2026
Mar 2026DMarket open
2,222.6USD+1.64%
RTYM2026
Jun 2026DMarket open
2,239.7USD+1.63%
RTYU2026
Sep 2026DMarket open
2,257.2USD+1.63%
RTYZ2026
Dec 2026DMarket open
2,274.6USD+1.64%
RTYM2027
Jun 2027DMarket open
2,309.0USD+1.64%
RTYZ2027
Dec 2027DMarket open
2,343.9USD+1.64%
RTYM2028
Jun 2028DMarket open
2,378.5USD+1.64%
See all RTY1! contracts
Frequently Asked Questions
The current price of E-Mini Russell 2000 Index Futures is 2,191.1 USD — it has risen 0.16% in the past 24 hours. Watch E-Mini Russell 2000 Index Futures price in more detail on the chart.
The volume of E-Mini Russell 2000 Index Futures is 8.41 K. Track more important stats on the E-Mini Russell 2000 Index Futures chart.
Open interest is the number of contracts held by traders in active positions — they're not closed or expired. For E-Mini Russell 2000 Index Futures this number is 391.43 K. You can use it to track a prevailing market trend and adjust your own strategy: declining open interest for E-Mini Russell 2000 Index Futures shows that traders are closing their positions, which means a weakening trend.
Buying or selling futures contracts depends on many factors: season, underlying commodity, your own trading strategy. So mostly it's up to you, but if you look for some certain calculations to take into account, you can study technical analysis for E-Mini Russell 2000 Index Futures. Today its technical rating is strong buy, but remember that market conditions change all the time, so it's always crucial to do your own research. See more of E-Mini Russell 2000 Index Futures technicals for a more comprehensive analysis.