Igl breakout long consolidation Igl breakout long consolidation..it's breaking the level it's going to fly
Next report date
≈
August 8
Report period
Q1 2025
EPS estimate
20.70 INR
Revenue estimate
19.52 B INR
105.35 INR
10.41 B INR
72.64 B INR
55.80 M
About MAHANAGAR GAS LTD.
Sector
Industry
CEO
Ashu Shinghal
Website
Headquarters
Mumbai
Founded
1995
ISIN
INE002S01010
FIGI
BBG00BGKKRB9
Mahanagar Gas Ltd. engages in the sale and distribution of natural gas. Its businesses include Domestic PNG, Commercial PNG, CNG, Industrial PNG, and Gas Geysers. The company was founded on May 8, 1995, and is headquartered in Mumbai, India.
10%
12%
14%
16%
18%
Q4 '23
Q1 '24
Q2 '24
Q3 '24
Q4 '24
0.00
5.00 B
10.00 B
15.00 B
20.00 B
Revenue
Net income
Net margin %
Revenue
COGS
Gross profit
Op expenses
Op income
Non-Op income/ expenses
Taxes & Other
Net income
0.00
5.00 B
10.00 B
15.00 B
20.00 B
Revenue
COGS
Gross profit
Expenses & adjustments
Net income
0.00
5.00 B
10.00 B
15.00 B
20.00 B
Q4 '23
Q1 '24
Q2 '24
Q3 '24
Q4 '24
0.00
900.00 M
1.80 B
2.70 B
3.60 B
Debt
Free cash flow
Cash & equivalents
No news here
Looks like there's nothing to report right now


Mahanagar Gas (MGL) – Big Move Loading?📊 **Mahanagar Gas (MGL) – Big Move Loading?** 🚀⚠️
MGL is **coiling within a tight range**, signaling that a **major breakout or breakdown** could be on the horizon! Traders should be ready as momentum builds.
### 🔎 **Technical Outlook:**
🔹 **Range-Bound Action:** The stock is stuck in a side

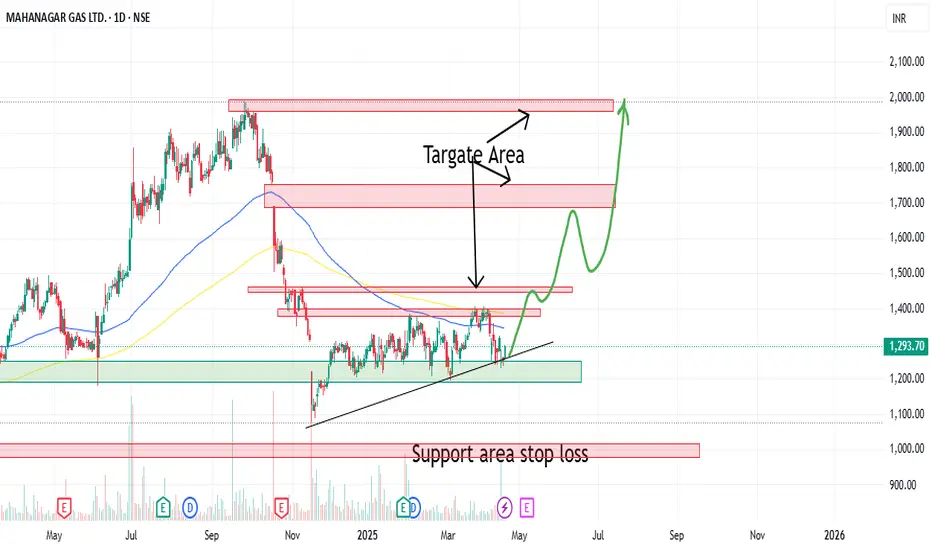
Stock Idea: Mahanagar Gas Limited (MGL)Price: ₹1,336.50
Target: ₹1,500
Stop Loss: ₹1,250
MGL shows solid support at ₹1,250 and potential resistance at ₹1,400. Watch for bullish momentum if RSI crosses above 60. A strong buy opportunity as demand for clean energy rises.
Disclaimer: This is not investment advice. Conduct your own researc


See all ideas
Summarizing what the indicators are suggesting.
Neutral
SellBuy
Strong sellStrong buy
Strong sellSellNeutralBuyStrong buy
Neutral
SellBuy
Strong sellStrong buy
Strong sellSellNeutralBuyStrong buy
Neutral
SellBuy
Strong sellStrong buy
Strong sellSellNeutralBuyStrong buy
An aggregate view of professional's ratings.
Neutral
SellBuy
Strong sellStrong buy
Strong sellSellNeutralBuyStrong buy
Neutral
SellBuy
Strong sellStrong buy
Strong sellSellNeutralBuyStrong buy
Neutral
SellBuy
Strong sellStrong buy
Strong sellSellNeutralBuyStrong buy
Displays a symbol's price movements over previous years to identify recurring trends.
Frequently Asked Questions
The current price of MGL is 1,348.80 INR — it has decreased by −0.38% in the past 24 hours. Watch MAHANAGAR GAS LTD. stock price performance more closely on the chart.
Depending on the exchange, the stock ticker may vary. For instance, on NSE exchange MAHANAGAR GAS LTD. stocks are traded under the ticker MGL.
MGL stock has fallen by −2.16% compared to the previous week, the month change is a −0.46% fall, over the last year MAHANAGAR GAS LTD. has showed a 3.69% increase.
We've gathered analysts' opinions on MAHANAGAR GAS LTD. future price: according to them, MGL price has a max estimate of 1,961.00 INR and a min estimate of 1,020.00 INR. Watch MGL chart and read a more detailed MAHANAGAR GAS LTD. stock forecast: see what analysts think of MAHANAGAR GAS LTD. and suggest that you do with its stocks.
MGL stock is 1.41% volatile and has beta coefficient of 1.22. Track MAHANAGAR GAS LTD. stock price on the chart and check out the list of the most volatile stocks — is MAHANAGAR GAS LTD. there?
Today MAHANAGAR GAS LTD. has the market capitalization of 133.24 B, it has decreased by −1.35% over the last week.
Yes, you can track MAHANAGAR GAS LTD. financials in yearly and quarterly reports right on TradingView.
MAHANAGAR GAS LTD. is going to release the next earnings report on Aug 8, 2025. Keep track of upcoming events with our Earnings Calendar.
MGL earnings for the last quarter are 25.50 INR per share, whereas the estimation was 24.71 INR resulting in a 3.20% surprise. The estimated earnings for the next quarter are 20.70 INR per share. See more details about MAHANAGAR GAS LTD. earnings.
MAHANAGAR GAS LTD. revenue for the last quarter amounts to 18.65 B INR, despite the estimated figure of 18.10 B INR. In the next quarter, revenue is expected to reach 19.52 B INR.
MGL net income for the last quarter is 2.47 B INR, while the quarter before that showed 2.21 B INR of net income which accounts for 11.66% change. Track more MAHANAGAR GAS LTD. financial stats to get the full picture.
EBITDA measures a company's operating performance, its growth signifies an improvement in the efficiency of a company. MAHANAGAR GAS LTD. EBITDA is 15.70 B INR, and current EBITDA margin is 21.61%. See more stats in MAHANAGAR GAS LTD. financial statements.
Like other stocks, MGL shares are traded on stock exchanges, e.g. Nasdaq, Nyse, Euronext, and the easiest way to buy them is through an online stock broker. To do this, you need to open an account and follow a broker's procedures, then start trading. You can trade MAHANAGAR GAS LTD. stock right from TradingView charts — choose your broker and connect to your account.
Investing in stocks requires a comprehensive research: you should carefully study all the available data, e.g. company's financials, related news, and its technical analysis. So MAHANAGAR GAS LTD. technincal analysis shows the sell today, and its 1 week rating is buy. Since market conditions are prone to changes, it's worth looking a bit further into the future — according to the 1 month rating MAHANAGAR GAS LTD. stock shows the neutral signal. See more of MAHANAGAR GAS LTD. technicals for a more comprehensive analysis.
If you're still not sure, try looking for inspiration in our curated watchlists.
If you're still not sure, try looking for inspiration in our curated watchlists.