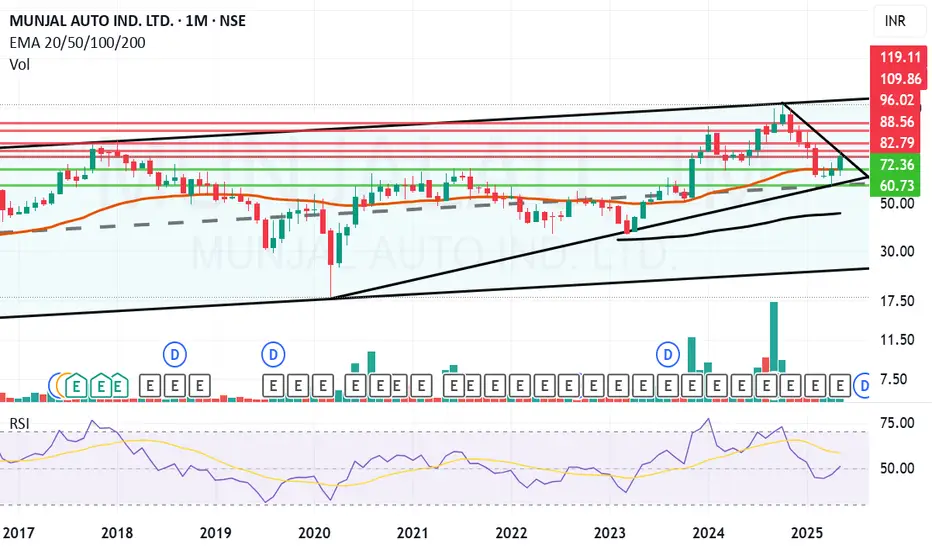
Munjal Auto giving a Breakout on Monthly chart. Munjal Auto Industries Ltd. engages in the production of automobile components. It operates through the Auto Components and Composite Products and Molds segments. It manufactures exhaust systems for two wheelers and four wheelers, spoke rims for two wheelers, steel wheel rims for two wheelers and four wheelers, fuel tanks for four wheelers, sheet metal components, seat frames for four wheelers, and other automotive assemblies.
Munjal Auto Closing price is 82.98. The positive aspects of the company are Companies with Zero Promoter Pledge, Companies with Low Debt and FII / FPI or Institutions increasing their shareholding. The Negative aspects of the company is Stocks Underperforming their Industry Price Change in the Quarter.
Entry can be taken after closing above 83 Historical Resistance in the stock will be 88.5 and 96. PEAK Historic Resistance in the stock will be 109 and 119. Stop loss in the stock should be maintained at Closing below 72.3 or 60.7 depending upon your risk taking ability.
Disclaimer: The above information is provided for educational purpose, analysis and paper trading only. Please don't treat this as a buy or sell recommendation for the stock or index. The Techno-Funda analysis is based on data that is more than 3 months old. Supports and Resistances are determined by historic past peaks and Valley in the chart. Many other indicators and patterns like EMA, RSI, MACD, Volumes, Fibonacci, parallel channel etc. use historic data which is 3 months or older cyclical points. There is no guarantee they will work in future as markets are highly volatile and swings in prices are also due to macro and micro factors based on actions taken by the company as well as region and global events. Equity investment is subject to risks. I or my clients or family members might have positions in the stocks that we mention in our educational posts. We will not be responsible for any Profit or loss that may occur due to any financial decision taken based on any data provided in this message. Do consult your investment advisor before taking any financial decisions. Stop losses should be an important part of any investment in equity.
MUNJALAU trade ideas


MUNJALAU NSE RBC&H BO WTF/MTF SWING/POSITIONALMUNJALAU STOCK Analysis
TRADE PLAN
ENTRY -118- 133 50% Qty, Add 50% qty 147 DTF Close
SL -107
TARGET --01-154 Swing , TGT02--178
Hold For a 1-2 Year or TGT 2
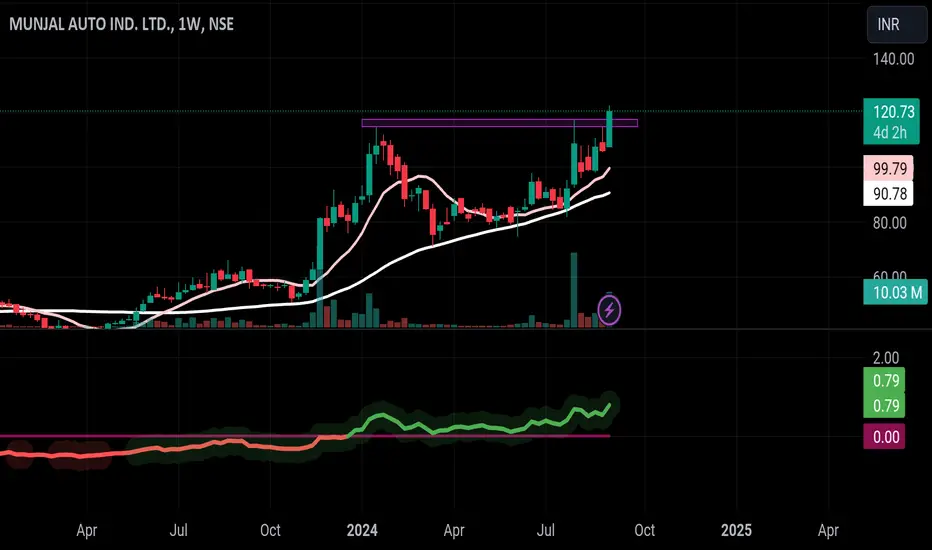
Chart Pattern :
STOCK had a formed a 6Y6M RBC and Handle of 8M.
INDICATORS EMA :
The Price is consistently Trading above 50EMA 4-5 Months on DTF, and 200 EMA to 21EMA are aligned in DTF/WTF .
FIBO/E :
Currently the price is above 23.6% FIBO Retracement Level, Early Entry can be take as per your risk ability. Safe Traders Enter above 147.
Volumes: There is a uptrend in Volume on the Weekly Charts for recent 3 Weeks and after the Pullback.
Keep in your Priority Watch List
Disclaimer: For Education/Reference Purpose Only, Trade at your Own Risk with correct position sizing and SL based on your Risk apetite (Exit when price closes 7to8% below your Entry).
Trail Your SL progressively. Learn/Know and Review the Stock trading Technical Terminology. Check Verify the Financial fundamentals of the Stock and Seek Advice from a Certified Financial Advisor prior to Investing. Prefer Entry with 25% quantity, Add in Tranches of 25%-50% as prices moves upwards recommended.
MTFA- Multiple Time Frame Analysis
DTF -Daily Time Frame
WTF-Weekly Time Frame
MTF- Monthly Time Frame
ATH-All Time High
LTH -LifeTime High
RBC&H-Rounding Bottom Cup/Handle
BO- Breakout Close
EMA -Exponential Moving Average
FIBO R/E -Trend based Fibonacci Retracement/Extension
SL Stop Loss
TBD- To be Decided
CHoCH- Change of Character Bullish/Bearish
MSB/BOS -Break Out Structure
FVG Fair Value Gap
20VMA -20Volume Moving Average
SWING/POSITIONAL Trade


Darvas Box Strategy - Breakout StockDisclaimer: I am Not SEBI Registered adviser, please take advise from your financial adviser before investing in any stocks. Idea here shared is for education purpose only.
Stock has given break out buy missed by one day. Keep this stock in watch list.
Buy above the High and do not forget to keep stop loss best suitable for swing trading.
Target and Stop loss Shown on Chart. Risk to reward Ratio / Target - 1:2.
Be Discipline, because discipline is the key to Success in Stock Market.
Trade what you See Not what you Think.

Munjal Auto Industries LtdTarget in chart
SL - 89
FUNDAMENTAL PARAMETERS
Market Cap
₹ 1,180 Cr.
Current Price
₹ 118
High / Low
₹ 119 / 50.5
Stock P/E
22.0
Book Value
₹ 40.1
Dividend Yield
1.73 %
ROCE
14.8 %
ROE
11.6 %
Face Value
₹ 2.00
Price to book value
2.91
Intrinsic Value
₹ 40.5
PEG Ratio
5.28
Price to Sales
0.63
Debt
₹ 276 Cr.
Debt to equity
0.69
Int Coverage
3.97
Reserves
₹ 381 Cr.
Promoter holding
74.8 %
Pledged percentage
0.00 %
EPS last year
₹ 3.85
Net CF
₹ -2.63 Cr.
Price to Cash Flow
9.28
Free Cash Flow
₹ 87.8 Cr.
OPM last year
6.40 %
Return on assets
3.66 %
Industry PE
37.0
Sales growth
-6.40 %

Munjal Auto Industries Ltd *Munjal Auto Industries Ltd*
RB Formation on Yearly Basis.
Strong Price BreakOut & Sustained.
Steady Vol Consolidation, Continued BuiltUp.
EMAs: Widening Gaps amongst 20/50/100/200.
RSI: 1H < D W>M>3M
*Trail SL with Upside*
*Book Profit as per Risk Appetite*
Do Your Own Research as well. This is an Opinion.
Happy Investing 😇


