SPY/QQQ Plan Your Trade For 5-22 : Inside Breakaway CountertrendToday's Inside Breakaway in Countertrend mode suggests the markets may attempt to move downward - away from the recent highs.
I believe the SPY/QQQ will move into a sideways/consolidation range over the next 3-5+ trading days before attempting to make any big moves. We have a holiday-shortened trading week next week, and I believe the markets are moving into the Summer doldrums.
Overall, I would ask traders to stay cautious of this transition in the markets over the next 5--10+ days and prepare for volatility to increase after June 1st.
You all know what I believe is the most likely outcome - a rollover topping pattern followed by a breakdown in price targeting the 525-535 level on the SPY. We'll see what happens going forward.
Gold and Silver pullback back overnight which suggests the metals markets were a bit overheated to the upside. I still believe Metals will continue to push higher.
BTCUSD is trading up above $111k. Here we go.
BTCUSD is moving up into the potential rejection level that I suggested in my 5-20 video as a MASSIVE WARNING setup.
This is where we'll see how BTCUSD plays out - if we continue to push higher or if we REJECT and move into a broad downtrend.
I didn't expect it to happen only TWO DAYS after my video - but here we are.
Time to get muddy and play what price puts in front of us.
Get some.
#trading #research #investing #tradingalgos #tradingsignals #cycles #fibonacci #elliotwave #modelingsystems #stocks #bitcoin #btcusd #cryptos #spy #gold #nq #investing #trading #spytrading #spymarket #tradingmarket #stockmarket #silver
SP500 trade ideas

Top 10 Rookie Trading Mistakes (And How to Laugh at Your Own)So you’ve just discovered trading. Maybe it started with a Reddit thread. Maybe someone said “trading Nvidia NASDAQ:NVDA is like printing money.” Or maybe you just liked the name “Shiba Inu” and figured memecoins was a good investment thesis.
Either way, welcome. This is where dreams are made, lost, rebought on leverage, and then tweeted about.
The markets are ruthless, but also educational — if you’re humble enough to learn and bold enough to laugh when you inevitably light your first $100 on fire by accidentally shorting Apple NASDAQ:AAPL during a breakout.
This article is for you. The new trader. The (overconfident?) beginner. Let’s talk about the top 10 rookie trading mistakes — and how to laugh at your own before the market does it for you.
1️⃣ Mistaking Luck for Skill (aka “Call Me Baby Buffett”)
Your first trade is a win. Your second is too. Maybe it’s a meme stock . Maybe it’s a hot IPO. Either way, you’re convinced you’ve cracked the matrix.
You tell your friends: “I just have a feel for this stuff.”
What actually happened: You got lucky in a trending market. And now you're about to go full Titanic on a position you didn’t research, because hey — you're "on a roll."
What you can do insead, and probably have a laugh about it years later, is screenshot your account right now in your very early steps. Frame it. Label it: Exhibit A in Emotional Risk Management.
2️⃣ The Revenge Trade: “I’ll Win It Back”
You took a loss. A big one. Your first real slap from the market. So what do you do? Walk away? Reflect? Journal it?
Nah. You go in twice as hard on the next setup. Same ticker. Same direction. More size.
Spoiler alert: It doesn’t end well.
That type of spiraling behavior usually happens when you think the market owes you something. It doesn’t. Not even an apology.
Imagine explaining your decision to a judge. “Your Honor, I lost money shorting Tesla, so naturally I doubled down five minutes later.” Case dismissed — and that’s why revenge trading is so dangerous .
3️⃣ FOMO FOMO FOMO
A green candle pops up on your watchlist. It’s moving. Fast. You missed the breakout but you still click “buy” because you’re not missing this train.
You get in. It tops. You hold. It drops. You panic. It rebounds… just after you sell.
Classic rookie cycle.
Why does this happen? The fear of missing out turns off your brain faster than a margin call. Call it what it is — chasing. Say it out loud like it’s therapy: “Hi, this is Patrick and I like to buy things 10% too late.” Maybe it helps.
4️⃣ “I’m Married to This Trade”
It started with a spark. The chart looked good. The RSI whispered sweet nothings. You thought, “This could be the one.”
So you bought. Then bought again. And when it dipped harder than your last relationship, you said, “It’s okay, we’re just going through a rough patch.”
Before you knew it, you weren’t trading — you were in a toxic relationship with a ticker.
You’ve abandoned your edge for emotion. Confirmation bias kicks in, and instead of managing risk, you’re managing denial. You stop analyzing the chart and start defending it like it’s your firstborn.
If you’re talking about a stock (or anything else on a chart) the way your friend talks about their ex — “It just needs time, I know it’ll come back” — you’re not trading. You’re coping.
5️⃣ All In, All the Time
Risk management? Never heard of that. You found a setup that “can’t fail,” so you went 100% in. On margin. On a Friday.
What could go wrong?
Answer: Everything. Especially when your trade gaps against you on Monday morning after Trump has said tariffs are changing once again.
That’s when you know you’re mistaking conviction for strategy. They’re not the same.
6️⃣ Ignoring the Bigger Picture
You nailed the 15-minute chart. Gorgeous breakout. But somehow, you forgot to check the daily — where your “breakout” is just a lower high in a brutal downtrend.
Oops.
Think about whether you've got tunnel vision. You went along with your short-term bias instead of checking the bigger picture when things are different.
What you can do instead, is make a rule: before every trade, zoom out. Literally. Leave no timeframe unexamined (at least up to the daily frame).
7️⃣ Trading Every Day Like It’s the Super Bowl
New traders think they have to trade every day. Every single session. Every little move.
And when there’s no good setup? They make one up, trying to whip up trendlines to justify their trading.
What happens next: Boredom trades. Overtrading.
Why it happens: You're addicted to the action, not the outcome.
What can you do instead? Write down the number of trades you made last week. Multiply it by the average commission you paid. Now imagine what you could’ve bought instead. And, what could be even better, consider taking a lesson in patience .
8️⃣ Blind Faith in Indicators
The RSI is at 18. The MACD just crossed. Stochastic says “maybe.”
So you buy. No price action. No trend. Just… vibes and indicators.
Result: You become a victim of the “indicator trap” — relying so heavily on these lines you forget to read the actual chart — momentum, market sentiment, broader technicals, and fundamentals.
What’s a better approach is to treat your indicators like seasoning, not the main dish. The best trades come from confluence, not wishful thinking dressed up as technical analysis.
9️⃣ The Trading Journal You Never Wrote
If you can’t remember why you entered a trade, you’re not at your best. Here’s a pro tip:
Keep a trading journal . One that records your thesis, entry, stop, target, and outcome. You know — the boring stuff that makes you better.
Why is that important? Journaling builds discipline. Patterns. Self-awareness. It’s never too late to start your journal!
🔟 Expecting to Get Rich Quick
This is the big one. The rookie mindset that kills most portfolios: I’m gonna turn $500 into $5,000 in a month.
You won’t. Sorry.
And even if you do, you won’t keep it.
Trading rewards patience, process, and preservation. Not YOLO bets and delusions of grandeur.
Try looking at your P&L like a diet. If you expect six-pack abs in a week, you’ll burn out and crash your progress. If you focus on habits? You’ll outlive the hype.
📚 Conclusion: Every Trader Starts Stupid
Let’s be clear — all of us have made these mistakes, even the big shots out there that run billion-dollar funds. The only difference between a rookie and a pro is how fast you learn from them. Or better yet — how fast you can laugh at them, document them, and evolve.
Because the truth is, the market is the most expensive comedy club on Earth. And every trade is a new punchline.
So if you're new, mess up. Take notes. Stay humble. And above all — enjoy the chaos. One day you’ll look back at your Doge CRYPTOCAP:DOGE top-buy with fondness.
After all, it’s only a mistake if you didn’t learn. Otherwise, it’s just tuition paid for by your trading account.
What’s a mistake we didn’t mention? Share your tips, tricks, mistakes, and lessons in the comment section!

This Guy has arrows down to 4400My last market update ended up receiving a comment from a Trading View user that seemingly was mocking the fact that my shorter-term chart posted in an update to my followers had directional arrows down to the approximate area of ES 4400.
Here's my longer-term expectations. If some didn't like 4400, I suspect they will equally dislike sub-ES 1,000.
Best to all.
Chris

Wick Tricks at Highs Based on conventional wisdom the SPX monthly chart looks super bullish with the big wick.
I want to explain how this can be misleading. For some "Creds" on the idea, I've attached a post made at almost exactly the low where I forecast the wick and spikes while stating this could be inside of a bearish setup. In the bearish setup, we'd often get bad news around this price.
These candles can be bullish, of course - I don't think I need to insult your intelligence by explaining the bullish read on these candles. You know them.
But did you know you also see one of these in almost every major top in history?
I just posted almost every notable drop from 2008 to 1966.
Here's a recent one.
I could go and start posting examples from the 1910s, but I hope I've made my point.
If it's a wick trap at a top, we generally will see a capitulation month within 3 months.
Usually, it'd be next month with this month closing weak to make a wick on top.

The Macro Importance of the 4.23 Breakout or Fake-outWe are at an incredibly interesting and unique point in SPX. I am fascinated to see how this ends up resolving.
Based on everything I know, these things predict extreme trend events come next.
First let's take a moment to qualify the idea the 4.23 is going to be important. The idea of using a line generated by a multiple of a swing that happened almost 20 years ago to make decision on what will happen in the next years sounds silly. I know that. But look at what happened on all of the previous fibs. Seeing is believing.
This doesn't tell me the 4.23 has to be important, but it supports the idea it may be. If you bet any of the previous fibs would not be important, you'd have been wrong. All of these did their thing in one way or another at one point. It's quite incredibly, really. Especially if you understand that these pullback/breaks levels are common any time you use these fibs in a developing trend. They tend to react to the same levels in the same ways. Then it happens on the Big Stage .It's amazing.
And if it continues, the next thing is ultra amazing.
The 4.23 head fake has disastrous forecasts. In the full play out of the 4.23 rejection we return to the 1.27 fib. In this case, that'd be a Depression style event. When a trend forms through fibs having all these pullback/break reactions and it gets to the 4.23, if the trend fails there -a massive mean reversion move happens.
When applied to a decade long rally, that would be horrific. This is the macro bear risk I have discussed at length, generally taking shorts into the fibs and covering/reversing long into supports). In the grand scheme of things the 4.23 area would be seen to have been essentially the top with some wild blow off action above it that turned into a head fake. We'd be right in the end times. A lot of nuance is needed for real trading but in a historical analysis it'd be seen that we were at the high now.
On the other hand, if the 4.23 breaks we usually see a move that is equal in size to all of the move before but happens in a fraction of the time. 4.23 breaks can be a wild with all supports/resistances being easily broken in big persistent candles. 4.23 breaks are rare, but they tend to put you into the most exceptional of price moves.
For context, when a 4.23 breaks when I am trading them on a 15 min chart prices are moving that fast I generally don't have time to do much. Even if I am sitting there watching at the exact moment it kicks off. It's like this;
"Wow! Okay I need to think what to ... WOW!".
Prices are moving too fast to process any reasonable plan. By the time you consider the situation you're in, you're in a totally different one. Nice conditions to be trailing stops. Hard to enter into.
The magnitude of a 4.23 break here would be astonishing based on the previously discussed norms. It'd predict that SPX would go into a move where it was doubling from the high. Furthermore, it was doing it in a tiny fraction of the time it took the previous rally.
For our doubling number it'd be best to take the breakout of the 4.23. Let's call it 5000 to keep it simple. Would give us an upside target of 10,000 in SPX without accounting for any stop hunting or overshoots. It would also imply that this happens in a crash up type of move. "Crash" being defined as a strong and sustained breaks of SR levels with no big reactions.
When it comes to tactical trading this is a total nightmare at this moment in time with the suggestion of massive profits (with potentially easy markets) in the coming year or so. At this point in time it's very tricky. If you accept the premise that either we're in a head fake over the 4.23 and a very aggressive rejection is coming or we're now into the start of what will become hyper over performance in the trend you have to consider this as a bit of a limbo point where there could be a chance to do well one way or the other but if you screw up something terrible will happen to you.
If it was a 4.23 fake out we'd have a super strong sell off. There could then be a big bull trap coming up to a double top/spike out and this would then turn into the most sensational of crashes down to under the 4.23- as the macro uptrend experiences what will become its first major trend failure.
The action in that move short term would be insane. There could be some late month rejection here (or next month) and then a massive monthly engulfing candle. We could see a month -20% or so and then see follow through down months. The amount the market could drop and how fast it'd be predicted to drop make it enticing to bet on this.
To bet on this, you have to bet into the rallies. There are too many times we dip and rip to try to sell after bear candles etc. They produce too many false signals. You can end up losing money even if you hit the big trade eventually. Betting on rallies allows you higher RR and when there are short term pullbacks you can get stops into even.
But that leads us to the headache ...
If we're inside a real breakout of the 4.23, we're in the foothills of what will become the most exceptional of rallies. During this, we should see massive high momentum moves up. These will generally go from one resistance level to another. Said differently, you'll see the spikes that seem ideal to fade into the levels you think are the levels to fade - and they won't be levels to fade.
Conversely, the bull strategy would have you aggressively buying all dips and breakouts. When you see momentum looking to get in one it quickly. If it pulls back, all the better. Doesn't matter if you take a string of losses because if you end up in lower at the end and it makes a new high you'll be net up on the round trip. The trend is going to be accommodating and it's only going to get better and better. You can't lose on the upside, and if you come at it in a really attacking way you could perhaps position before a massive upside move.
But you might be doing that into the very end of the trend and have all sorts of sickening gap risk/slippage risk and margin call risk.
Of course, the 4.23 thing might end up not even being important. But from the lens I see markets through, I have to think it will be. If it's not, I'll be surprised. And it makes me believe that whatever way it goes there has to be something exceptional.
When it comes to these juxtaposed outcomes watching price is not all that helpful. Because this can happen in an up move.
With this happening in a down move.
It can be really hard to tell things apart until the point where you've lost is crossed.
If we break the high and you think we're going higher, it's important to be aware of the risk of a bigger pullback. But it can just break and run, too.
Or to the downside it could break abruptly.
Breaks more commonly have traps in them and would look something like this.
So we have a unique situation where I think it's fully justifiable to expect there would be exceptional moves with the market going up 100% or down over 60% - and both of these would be expected to happen within a short period of time. Bulk of it over a couple years. But the nuances of how to go about positioning in a risk efficient way are tricky.
On the bear side, you should be fading this rally and looking to build positions into drops as they develop. But if you're doing that against a bull trend you'll get decent entries if you're good with resistances but build up a position into support and end up down/even on all your entries. And you'll lose a lot of entries with no reaction - so you'll lose overall.
On the buy side you should be aggressively accumulating and buying close to supports but in the 4.23 head fake thesis this would be literally the worst time in your life to do that.
If you're buying and we go up and breakout, you should buy more. But if it's a breakout/correction then you'll get nailed. You can buy more into the correction but you might be "Exit liquidity" in the dump. In the dump, you can short aggressively but are liable to get cut up a dozen different ways.
This set of dilemmas are always something faced when you're trading at a binary inflection point. Even on small charts when we trade at 1.61/2.61 and 4.23 levels this set of paradoxes exist and are tricky to know exactly what's best to to do - on the Big Stage, it's mindboggling the different things that may happen. And daunting knowing the different traps.
If this 4.23 thing is going to be right, the one thing that is sure is there's going to be well above average chances to make big money when the 4.23 decision is resolved.
The 4.23 rejection would be a terrible event. And with who knows what types of real world impacts/reasons. From an intellectual standpoint it is fascinating. If we went into that style of crash now we'd have done it off basic TA patterns, mirroring major crashes of the past and even the interest rates cycles would have been the same as previous bubbles. In the final analysis of it, almost all aspects of the formation and bust of the bubble would have been foreseeable with basic pattern matching ideas. All of the things that have happened in the last 50 years and then all of the crazy things that'd have to happen for a depression crash in the years to come - all foreseeable with extremely basic pattern ideas. The fact everything has matched as well as it has so far trading through the fibs is already remarkable. If it was punctured by a mean reversion fat tail ... wow! On a personal level, even just in the minor drops of 2020, 2022 and recent one it's clear to see indices going down a lot is going to really hurt people. At this point we're just seeing this in speculators but it makes me think about what this would be like on a grand scale. It'd not be nice.
The 4.23 breakout thesis is fascinating and exhilarating. A prospect of heading into the major boom section of a mega trend and having full awareness of that being what you're heading into and approximately where you can expect that to end up going. These would be conditions where someone who knows what they're doing can make insane amounts of money. Even just showing up will make money (as long as you don't end up overstaying). In this extreme doubling event we would still be predicting bad times ahead - but they'd be differed by a couple of years. From a selfish point of view this would all seem great. To benefit from a bubble and be able to bet on a spectacular reversal later. From a humanistic point of view it seems like it'd only cause greater devastation later. No one cares now because we're back at all time highs and boohoo anyone who sold the bottom, but at the lows of April there were anti suicide posts pinned in trading forums. That's how bad things are now on a 20% drop. Think how much worse they'd get if mania develops more.
It's an interesting time. For the sake of sanity and profitability I am doing my best to be as agnostic as possible about what the outcome will be. Plan for all, execute as suitable. I hope we see the 4.23 break. It's the better of the trading ops (Since it offers two massive swings) and if we can crash up or down by the same amount of points, who cares which way it goes? Trading long can be logistically easier in many ways, so it'd be the preference if all else was equal. And being a bear is tiring. It's particularly tiring having to explain to people stating a statistical observation on a SR level doesn't mean you're depressed, angry, a shill and having a different opinion about markets does not mean you hate them. So they don't have to try to fight with you. Every 5 mins...
If you're a bull and say something will go from 100 to 130. And it goes to 40 then it goes to 129 ... you were always right. That's what people say. If you're a bear at 100 and it goes to 120 then 40 you were an idiot that got lucky eventually. I always find that funny about social media.
We're in interesting times. If my 4.23 hypothesis turns out to be correct we're heading into the history books. It's just a question of "For what?.

Is minor B done?In my last post…” We Have a Full Pattern into The Target Box” … I stated, “I am now looking for a 5-wave pattern to develop to the downside, followed by a 3-wave retrace, that in the coming weeks can take us back out of the target box to the downside.”
That pattern may have begun today in the very micro sense. This is very preliminary, so we need follow through to the downside so that in the days and weeks to come, we can confirm a top in minor B.

US500: Bullish Trend Holds Despite Moody’s DowngradeUS500: Bullish Trend Holds Despite Moody’s Downgrade
On Sunday, Moody’s downgraded U.S. debt to AA1, citing rising interest costs and unsustainable debt growth. They noted that U.S. debt funding costs are much higher compared to similar economies, with interest payments significantly exceeding those of similarly rated countries.
At the market open on Monday, US500 dropped from 5959 to 5874, losing nearly 1.40%. While this downgrade was expected to have a bigger impact, the index quickly recovered, reaching a new high of 5972 after the U.S. market opened.
Despite the initial dip, US500 remains in a strong bullish trend. Unless a major event shifts market sentiment, the index is likely to continue rising. Even if small corrections occur, the overall trend is still intact.
You may find more details in the chart!
Thank you and Good Luck!
❤️PS: Please support with a like or comment if you find this analysis useful for your trading day❤️

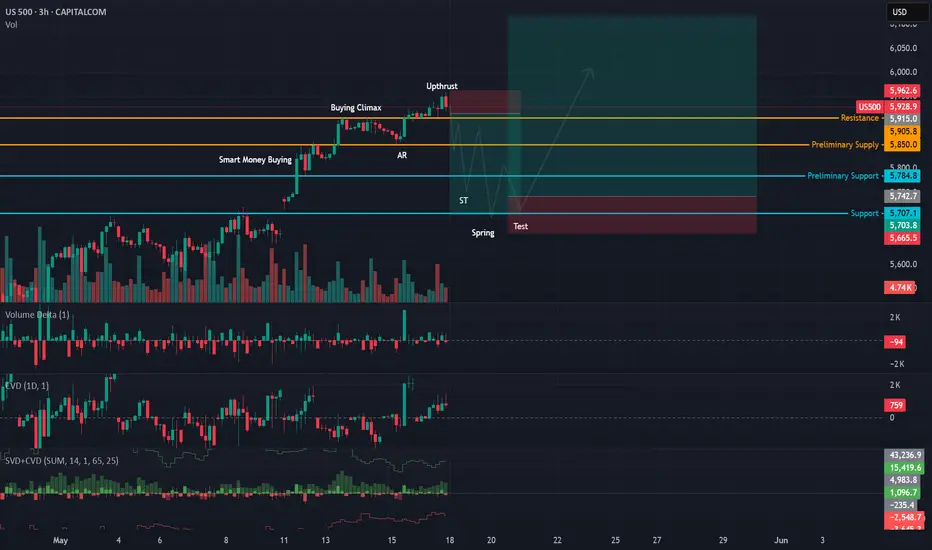
US500 | Potential Wyckoff Reaccumulation UnfoldingThe US500 appears to be working through a classic Wyckoff reaccumulation phase following a strong rally during price mark-up. After a swift move upward, price formed what looks like a Buying Climax , followed by an Automatic Reaction (AR) and now an Upthrust at the recent highs.
So far, volume and delta behavior are aligning well with this. During the upthrust , we saw increased volume, but delta turned negative, indicating selling pressure into strength. This was also accompanied by a CVD divergence, showing that although price pushed to new highs, the underlying buying wasn't supporting the move just yet. That often hints distribution by strong hands as late buyers step, likely fuel by the good ol' Trump Pump.
With that in mind, a pullback into the lower range is expected to create the Secondary Test (ST) . This could lead to a possible Spring , a shakeout below recent support (around the 5700–5720 zone) meant to trap sellers. Ideally, this would be followed by a Test , where price returns to the Spring zone on lower volume and stronger delta/CVD confirmation, signaling demand returning and absorption of supply. But this is all to be determined.
This doesn't have to play out exactly as I mapped. But if we see something similar play out, it would lead to higher prices and confirmation of the mark-up phase. Until then, patience is key, this phase of the structure is about traps and tests, not breakouts.
S&P 500 Breaks Out — Trump, Tariffs & Bullish Island PatternDonald Trump has mentioned the US stock market in every meeting he has held in the past few days, which has caused the US stock market indices , including the S&P500 Index ( SP:SPX ), to rise:
"Better go out and buy stocks now".
President Donald Trump told a crowd in Saudi Arabia on Tuesday that the markets are just getting started. “It’s going to get a lot higher,” he said, right as the S&P 500 posted its first gain since late February.
But one of the main reasons for the increase in the S&P 500 Index and US stocks is The United States has dropped its tariffs on Chinese goods to 30% , down from a brutal 145% , while China is slashing its own duties on US imports to just 10% , temporarily, for the next 90 days .
-------------------------------------------------
Now let's take a look at the S&P 500 Index chart on the daily time frame .
S&P500 Index managed to break the Resistance zone($5,737_$5,506) and 21_SMA(Weekly) by Breakaway Gap .
In terms of Classic Technical Analysis , the S&P500 Index has managed to form a Bullish Long Island Pattern , and this pattern is one of the continuing patterns and will be a sign of the continuation of the S&P500 Index's upward trend .
In terms of Elliott Wave theory , it seems that the S&P500 index has completed the corrective wave and is in new impulsive waves , which could cause a new All-Time High(ATH) to form.
I expect the S&P500 index to increase by at least +5% as it approaches the Uptrend line , and we will see the possibility of a new ATH .
Please respect each other's ideas and express them politely if you agree or disagree.
S&P 500 Index Analyze (SPX500USD), Daily time frame.
Be sure to follow the updated ideas.
Do not forget to put a Stop loss for your positions (For every position you want to open).
Please follow your strategy and updates; this is just my Idea, and I will gladly see your ideas in this post.
Please do not forget the ✅' like '✅ button 🙏😊 & Share it with your friends; thanks, and Trade safe.


The Bullish view under ELLIOT WAVE top of 3 6181/6235Based On what has been happening in the structure in The SP 500 I tend to think the sp cash sees a retest at 6417 or extend the rally to 6181 alt 6230 for the top of #wave 3 or Wave B . both should see a 350 point decline back to 5830/ If 5 is equal to One a 646 point rally should be seen in wave 5

Bullish continuation?S&P500 (US500) is falling towards the pivot which is a pullback support and could bounce to the 1st resistance which aligns with the 138.2% Fibonacci extension.
Pivot: 5,782.52
1st Support: 5,692.37
1st Resistance: 6,138.06
Risk Warning:
Trading Forex and CFDs carries a high level of risk to your capital and you should only trade with money you can afford to lose. Trading Forex and CFDs may not be suitable for all investors, so please ensure that you fully understand the risks involved and seek independent advice if necessary.
Disclaimer:
The above opinions given constitute general market commentary, and do not constitute the opinion or advice of IC Markets or any form of personal or investment advice.
Any opinions, news, research, analyses, prices, other information, or links to third-party sites contained on this website are provided on an "as-is" basis, are intended only to be informative, is not an advice nor a recommendation, nor research, or a record of our trading prices, or an offer of, or solicitation for a transaction in any financial instrument and thus should not be treated as such. The information provided does not involve any specific investment objectives, financial situation and needs of any specific person who may receive it. Please be aware, that past performance is not a reliable indicator of future performance and/or results. Past Performance or Forward-looking scenarios based upon the reasonable beliefs of the third-party provider are not a guarantee of future performance. Actual results may differ materially from those anticipated in forward-looking or past performance statements. IC Markets makes no representation or warranty and assumes no liability as to the accuracy or completeness of the information provided, nor any loss arising from any investment based on a recommendation, forecast or any information supplied by any third-party.

Super-cycle top in? I was considering that we had an extended wave 1 from march 2009 to feb 2020, the wave 2 bottom was march 2020, then wave 3 top was jan 2022, wave 4 bottom was oct 2022 and now we are on wave 5. This would be an extended wave 1 instead of wave 3 and that means wave 3 & 5 should be equal and with the current top that would put them within 1.1% of each other. This also fits with the alternating pattern with wave 2 being quick and simple and wave 4 being long and complex. Thoughts?

Moody’s U.S. Downgrade – Why Markets May Stay ResilientMoody’s downgrade of the U.S. credit rating from Aaa to Aa1 is notable but unlikely to trigger a major market sell-off. Here’s why:
Why a Severe Drop Is Unlikely:
Already Priced In: Follows similar actions by S&P (2011) and Fitch (2023); markets may have already adjusted.
Minimal Regulatory Impact: Aa1 is often treated similarly to Aaa in capital and collateral rules.
Stable Outlook: Signals no immediate risk of further downgrades, offering reassurance.
U.S. Strengths Intact: Economic size, resilience, and dollar reserve status continue to underpin investor confidence.
Possible Reactions:
Treasury Yields: May rise slightly on risk re-pricing.
Equities: Modest pullback possible, but no sharp correction expected.
Sentiment: Could revive fiscal debate, but not a game-changer for positioning.
Conclusion: The downgrade highlights longer-term fiscal concerns but is unlikely to cause immediate market turmoil.
#Moody’s #USDebt #CreditDowngrade #MarketOutlook #TreasuryYields #SPX #RiskSentiment

S&P500: Vanna Snapback is Over – Short Gamma Drift Underway Belo📝 Summary
Short gamma regime re-entered after 20Y auction shock. Below 5870, dealers face structural sell pressure from vanna + gamma + charm convergence. Wait for VIX to fall before buying any dip.
📊 Price Levels to Watch
🔺 Upside Breakout Trigger: 5885
→ Reclaiming this level flips dealers back toward neutral gamma, opening short-covering squeeze potential toward 5925–5950
🔻 Downside Acceleration Zone: 5870
→ Structural pressure zone. Vanna-driven delta hedging intensifies. Below here, the market enters a volatility expansion regime
🧱 Gamma Walls:
Call Wall: 5950
Put Walls: 5875 / 5850 / 5800
🔍 Structural Regime Analysis
Macro trigger:
Last night’s 20Y Treasury auction was weak, triggering a sharp risk-off move.
SPX broke 5935 → 5875 in 15 mins, entering short gamma zone (GEX 🔴🔴).
Volatility Regime Shift:
VIX spiked >20, breaking the downward vol trend that supported recent vanna snapback rallies.
This marks the end of volatility compression. Vol expansion regime is in effect.
Dealer Hedging Mechanics:
Below 5870, Vanna pressure increases sharply as price declines + IV rises.
Dealers short puts must delta hedge by selling ES, amplifying downside in a feedback loop.
No Dip Buy Until Vol Stabilizes:
VIX must fall or implied volatility flatten before any long bias resumes.
Until then, treat rebounds as short entries, not long setups.
⚠️ Volatility Metrics Supporting This View
GEX: 🔴🔴 (Negative Gamma on both 0DTE and aggregate expiries)
IVx 5D Change: +4.04% → Implied volatility rising into the drop
PUT$: 85.6% → Option flow heavily defensive (puts > calls)
Skew: High, supporting demand for tail risk hedging
🧭 Tactical Strategy
Short bias below 5870, scale-in entries on failed intraday bounce attempts
First targets: 5850 → 5800 (Put gamma cluster + dealer momentum zone)
Invalidate short above 5885 (where short gamma neutralizes)
📌 Final Note
We are now inside a third-order Greeks-driven sell zone:
Speed ↑, Color ↑, Ultima ↑ → this is a self-reinforcing volatility trap.
No long setups are valid until structural vol metrics cool down.


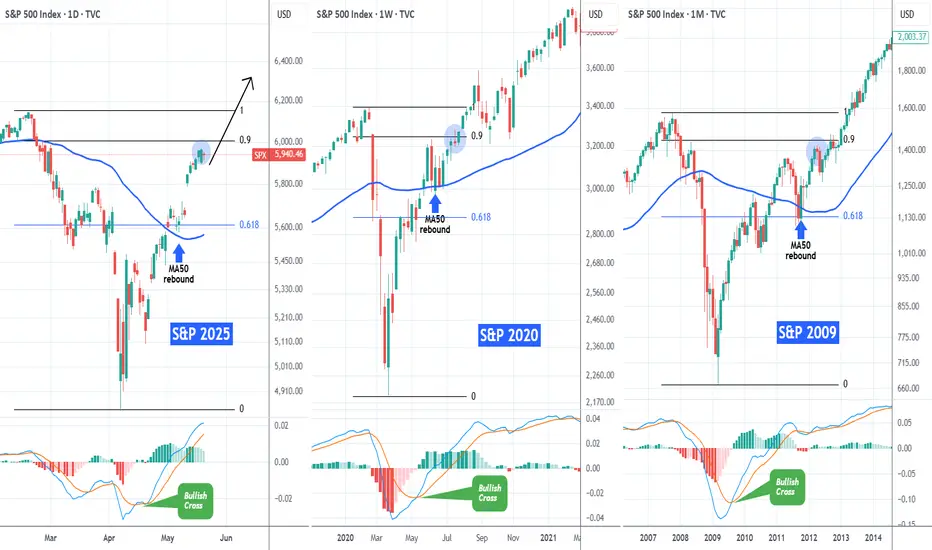
S&P500 Same recovery path with 2020 and 2009The S&P500 index (SPX) has recovered almost 90% of its losses since the February 19 2025 All Time High (ATH) and many have already started calling for a technical correction.
If we compare however this 2025 Tariff fueled correction with the recent most aggressive ones (COVID crash in 2020 and Housing Crisis 2008/2009) we see a different picture.
On their respective 0.9 Fibonacci levels (close to which we are today), both of those market recoveries went straight to new ATHs, without testing their MA50 (blue trend-line) until the next Cycle peak. They had that tested before when the price was trading near (or on)the 0.618 Fib. Notice also how a MACD Bullish on all three charts, confirmed the aggressive recovery pattern straight after the bottom.
Instead of a correction, history shows that we might be looking at new ATH soon.
-------------------------------------------------------------------------------
** Please LIKE 👍, FOLLOW ✅, SHARE 🙌 and COMMENT ✍ if you enjoy this idea! Also share your ideas and charts in the comments section below! This is best way to keep it relevant, support us, keep the content here free and allow the idea to reach as many people as possible. **
-------------------------------------------------------------------------------
💸💸💸💸💸💸
👇 👇 👇 👇 👇 👇
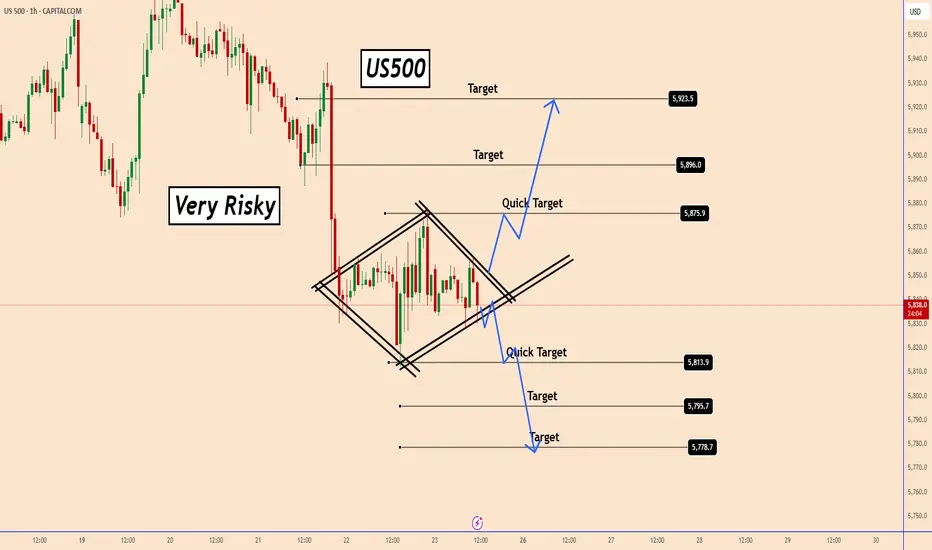
US500 at a Crossroads: Diamond Pattern in PlayUS500 at a Crossroads: Diamond Pattern in Play
US500 is forming a small diamond pattern, but the risk is high since the pattern is still developing and could evolve further.
The price shows signs of a decline, but a strong breakout is needed to confirm the movement.
Diamond patterns are typically trend continuation setups, but the final direction depends on where the breakout happens.
Both scenarios are well explained on the chart
PS: The best approach is to wait for the breakout before taking action.
THIS SETUP IS VALID ONLY FOR TODAY
You may find more details in the chart!
Thank you and Good Luck!
❤️PS: Please support with a like or comment if you find this analysis useful for your trading day❤️

S&P500 Short: Update to Wave StructureAs mentioned, this is the 4th attempt to catch the peak for S&P500 (and Nasdaq). Over here, I break down the details of the wave structure to the subminuette level at the final wave. I believe this to be the final peak given that I do not see any more extension possible without changing the entire up-move wave labelling.
As usual, manage your risk and use a stop loss above the end of Wave Y.
Good luck!

Stocks Have Been in a Bear Market for 25 Years, By This MeasureThe S&P 500 hit a new all-time high in February. However, by one measure it’s been in a bear market all century.
Today’s monthly chart shows SP:SPX as a ratio against gold. Using this comparison, equities have underperformed since Bill Clinton was still President in August 2000.
It illustrates how stocks languished in the 1970s, before starting an 18-year run against the “barbarous relic” (to borrow from John Maynard Keynes). Then the great equity bubble broke and investors began their first migration back into gold. They subsequently diversified into emerging markets, triggering a secular bear market in U.S. stocks that ended with the subprime crisis.
The S&P 500 continued lower against bullion until 2011, when the People's Bank of China turned hawkish. A year or two later, stocks entered a new bull market by breaking above their previous high from 2007.
That uptrend continued until late 2021, when post-pandemic inflation lifted interest rates. Gold interestingly held its ground as the Federal Reserve tightened policy, an early sign of emerging strength.
The next interesting moment was early 2024, when stocks and the yellow metal both broke out to new highs. However, the S&P 500 still made a lower high when expressed as a ratio against gold.
Given worries about the U.S. fiscal deficit, inflation and de-dollarization, some investors may wonder whether the trend that began 25 years ago may remain in effect.
Check out TradingView's The Leap competition sponsored by TradeStation.
TradeStation has, for decades, advanced the trading industry, providing access to stocks, options and futures. If you're born to trade, we could be for you. See our Overview for more.
Past performance, whether actual or indicated by historical tests of strategies, is no guarantee of future performance or success. There is a possibility that you may sustain a loss equal to or greater than your entire investment regardless of which asset class you trade (equities, options or futures); therefore, you should not invest or risk money that you cannot afford to lose. Online trading is not suitable for all investors. View the document titled Characteristics and Risks of Standardized Options at www.TradeStation.com . Before trading any asset class, customers must read the relevant risk disclosure statements on www.TradeStation.com . System access and trade placement and execution may be delayed or fail due to market volatility and volume, quote delays, system and software errors, Internet traffic, outages and other factors.
Securities and futures trading is offered to self-directed customers by TradeStation Securities, Inc., a broker-dealer registered with the Securities and Exchange Commission and a futures commission merchant licensed with the Commodity Futures Trading Commission). TradeStation Securities is a member of the Financial Industry Regulatory Authority, the National Futures Association, and a number of exchanges.
TradeStation Securities, Inc. and TradeStation Technologies, Inc. are each wholly owned subsidiaries of TradeStation Group, Inc., both operating, and providing products and services, under the TradeStation brand and trademark. When applying for, or purchasing, accounts, subscriptions, products and services, it is important that you know which company you will be dealing with. Visit www.TradeStation.com for further important information explaining what this means.

If SPX Uptrends Above 86 Fib, It's Buy All DipsIt's really surprising to see SPX rallying again today after the 86 fib hit - with the drop off it holding basic trending conditions.
This doesn't happen very often. When you look at all instances of this in SPX history you'll find about 80% of the time it drops much more from here. Whether it's a bull or bear move overall.
In this area there's a lot of risk of being rugged on the long side because the move is hyper extended / high ATR and even a moderate correction can be 10% - however, if we continue to consistently uptrend above the 86, then it's buy all dips.
When an 86 breaks without any notable pullbacks, it tends to trend on small timeframes. Bluffs bear moves a lot - but keeps holding inside the last low and makes new highs.
This is something that can happen inside of both tops and breakouts. Topping moves can spike out the high by a nominal amount and then drop - like the2007 high did.
Trending moves can break the high, hold retests and continue to grind up, like the 2021 rally did.
In either event - the smart bet is to buy all the dips because they offer 1:3 RR, you'll usually only have to lose 3 of them to work out that's a bad idea and that means it's quite unlikely youll lose money - conversely, if it continues to uptrend, you'll make bank!
If the 86 is not a resistance level, then next upside level is 6130. This would seem best case scenario for bears.
In the bigger picture, SPX has come down off extremely important long term resistance levels. These could be a major top. It's a considerable risk ... but if those levels are going to break, then we are probably going to head into exceptional uptrends.
If we do not top out at the macro resistance levels, then it's probably going to become close to impossible to make money as a bear. And I mean that in terms of over the next couple years. Not just for a little while.
The last 5 yrs have been optimal yrs to be willing to trade both sides of risk assets. There have been a lot of ups and down. I think if we have a failure of the bear attempt here that will turn into a market that's very unfriendly to bears. Even if you only trade good levels you'll lose money.
If you used good entry and stop trailing rules, there've been fortunes to be made on the bear side of the last years.
But if we break this time, I find it very unlikely you'll see me being bearish for the foreseeable future.
The upside potential on a monthly resistance break here would be staggering.
While we were at the low I made a detailed explanation of how my bias over the coming years would be informed by the outcome of the rally. We're into the action end of that now.
If we uptrend above resis, it's buy all dips. There could be a tricky spike out bull trap and there could be an exceptional rally.
In the rally scenario, we'd soon enter into conditions where massive profits could be made over the next 2 year.

Correction and up for SPX500USDHi traders,
Last week SPX500USD slowly went up some more. The pullbacks are overlapping so it looks like price is forming a leading diagonal (wave 1).
I'm still expecting a downmove because of the price action. Price came into the 4H FVG and is showing a bearish doji. So next week we could see a (corrective) move down.
Let's see what the market does and react.
Trade idea: Wait for price to develop some more before you take any trades.
If you want to learn more about trading FVG's & liquidity sweeps with Wave analysis, then please make sure to follow me.
This shared post is only my point of view on what could be the next move in this pair based on my technical analysis.
Don't be emotional, just trade your plan!
Eduwave

Hellena | SPX500 (4H): SHORT to 38.2% - 50% Fibo lvl 5489.Colleagues, I have reviewed the waves a bit and I believe that when the strong psychological level of 6000 is reached, a reaction and correction in wave “2” is possible.
I propose to consider this movement as a strong five-wave movement. Wave “1” will be over soon.
I consider the 38.2% - 50% Fibonacci levels of 5489 to be the main target of the correction.
Manage your capital correctly and competently! Only enter trades based on reliable patterns!
