USD/JPY - Triangle Breakout (06.06.2025)The USD/JPY pair on the M30 timeframe presents a Potential Buying Opportunity due to a recent Formation of a Triangle Pattern. This suggests a shift in momentum towards the upside and a higher likelihood of further advances in the coming hours.
Possible Long Trade:
Entry: Consider Entering A Long Position around Trendline Of The Pattern.
Target Levels:
1st Resistance – 144.94
2nd Resistance – 145.52
🎁 Please hit the like button and
🎁 Leave a comment to support for My Post !
Your likes and comments are incredibly motivating and will encourage me to share more analysis with you.
Best Regards, KABHI_TA_TRADING
Thank you.
Disclosure: I am part of Trade Nation's Influencer program and receive a monthly fee for using their TradingView charts in my analysis.
U.S. Dollar / Japanese Yen
143.454JPYR
−0.025−0.02%
As of today at 21:25 GMT
JPY
No trades
USDJPY trade ideas

USD/JPY...1h chart pattern..Here's a quick summary of MY USD/JPY trade setup:
---
Trade Idea: SELL USD/JPY @ 144.000
Entry Point: 144.000
Target 1 (TP1): 143.400 → +60 pips
Target 2 (TP2): 142.400 → +160 pips
Suggestions:
Stop Loss (SL): Consider setting a stop loss above recent resistance (e.g., 144.500 or 144.800) to manage risk.
Risk/Reward Ratio:
For TP1: 1:1 with SL @ 144.600
For TP2: ~2.6:1 with SL @ 144.600
Key Technical Zones:
Watch for support near 143.400 (TP1); possible bounce or consolidation.
142.400 is a deeper move — stronger confirmation needed (e.g., a break below 143.400 with volume).
Let me know if you’d like a chart analysis or updates on news that could impact this trade.

USD/JPY – Short-term bullish structure within a larger downtrendThe USD/JPY pair has been in a well-established downtrend on the daily timeframe, showing consistent weakness over recent weeks.
Daily timeframe
The pair recently bounced from a significant and well-respected support zone around the $140.00 level. This area has historically provided a strong base for price, and once again, it appears to be holding as reliable support. Although the overall daily trend remains bearish, this bounce introduces the potential for a short-term retracement or consolidation phase.
Clear Rising Trendline on the 4H Chart
Zooming into the 4-hour timeframe, the price action shows a notable shift in momentum. A clear rising trendline has formed, acting as a dynamic support level and guiding the pair higher in the short term. As long as this trendline remains intact and unbroken, the bullish bias on the 4H remains valid. This upward move suggests a corrective phase within the broader daily downtrend, supported by increasing demand at higher lows.
Approaching Key Resistance — FVG and 0.786 Fibonacci Level
The pair is currently approaching a key resistance area near the $145.50 level. This zone aligns with the 4-hour Fair Value Gap (FVG) left by the previous strong downward move and coincides with the 0.786 Fibonacci retracement level, measured from the most recent swing high to swing low. A few days ago, price action briefly tested the lower boundary of this FVG but failed to fully fill the imbalance. Given the current momentum, another attempt to fill the entire FVG and test the 0.786 Fibonacci level is likely. This confluence of technical factors creates a strong resistance zone that could trigger significant price reactions, potentially resuming the broader downtrend.
Target Levels — Where to Look for Reversal or Profit-Taking
A sensible short-term target would be the previous lower high around the $144.00 level. This zone may serve as an initial resistance or take-profit area before price challenges the $145.50 resistance region. Additionally, if the pair breaks below the rising trendline on the 4H, this $144.00 zone could become a support level from which the pair might attempt another move higher.
Conclusion
To summarize, the USD/JPY pair remains in a broader daily downtrend but has shown signs of short-term strength after bouncing from the $140.00 support zone. On the 4-hour timeframe, bullish momentum is evident, supported by a rising trendline and upward movement toward a significant resistance area. Traders should closely watch the $145.50 zone, as it represents a confluence of the FVG and 0.786 Fibonacci retracement — both of which could act as a strong ceiling for price. Until the rising trendline breaks, the short-term outlook remains cautiously bullish, but the medium-term bias leans bearish if resistance holds and selling pressure resumes.
Disclosure: I am part of Trade Nation's Influencer program and receive a monthly fee for using their TradingView charts in my analysis.
Thanks for your support.
- Make sure to follow me so you don't miss out on the next analysis!
- Drop a like and leave a comment!

GBPUSD next move (expecting mild bullish)(06-06-2025)Go through the analysis carefully, and do trade accordingly.
Anup BIAS (06-06-2025) (short term)
Current price- 144.000
"if Price stay above142.130 then next target is 145.000 and 146.500"
-POSSIBILITY-1
Wait (as geopolitical situation are worsening )
-POSSIBILITY-2
Wait (as geopolitical situation are worsening)
Best of luck
Never risk 2% of principal to follow any position.
Support us by liking and sharing the post.

Bullish bounce off pullback support?USD/JPY is falling towards the support level which is a pullback support that os slightly above the 23.6% Fibonacci retracement and could bounce from this level to our take profit.
Entry: 144.27
Why we like it:
There is a pullback support level that is slightly above the 23.6% Fibonacci retracement.
Stop loss: 143.36
Why we like it:
There is an overlap support level that is slightly below the 61.8% Fibonacci retracement.
Take profit: 146.07
Why we like it:
There is a pullback resistance level.
Enjoying your TradingView experience? Review us!
Please be advised that the information presented on TradingView is provided to Vantage (‘Vantage Global Limited’, ‘we’) by a third-party provider (‘Everest Fortune Group’). Please be reminded that you are solely responsible for the trading decisions on your account. There is a very high degree of risk involved in trading. Any information and/or content is intended entirely for research, educational and informational purposes only and does not constitute investment or consultation advice or investment strategy. The information is not tailored to the investment needs of any specific person and therefore does not involve a consideration of any of the investment objectives, financial situation or needs of any viewer that may receive it. Kindly also note that past performance is not a reliable indicator of future results. Actual results may differ materially from those anticipated in forward-looking or past performance statements. We assume no liability as to the accuracy or completeness of any of the information and/or content provided herein and the Company cannot be held responsible for any omission, mistake nor for any loss or damage including without limitation to any loss of profit which may arise from reliance on any information supplied by Everest Fortune Group.

Analysis of Trades and Trading Tips for the Japanese YenThe price test at 144.27 occurred when the RSI indicator had already moved significantly above the zero line, but the strong U.S. labor market data offered a high probability of the dollar strengthening against the yen, which I decided to take advantage of. As a result, the pair rose toward the target level of 145.06.
The confident growth in U.S. non-farm employment recorded in May exceeded experts' expectations' causing noticeable fluctuations in currency, markets. The publications of data showing the creation of 139,7000 new jobs versus the forecasted 127,000 instantly strengthened the U.S. dollar, putting pressure on the Japanese yen. The yen's reaction to the news was immediate: the currency weakened significantly against the dollar. Investors perceived the data as a signal of the strength of the U.S. economy and the likely continuation of Federal Reserve's tight monetary policy. Furthermore, the stable unemployment rate in the U.S. recorded at 4.2%, also reinforced the market's optimistic sentiment.
Today's data shows that Japan's GDP for the first quarter was revised upward, which helped the yen recover slightly from Friday's losses against the U.S. dollar. However, despite the positive revision, Japan's economy still faces serious challenges. Weak domestic demand and an aging population continue to pressure growth, while geopolitical uncertainty poses additional obstacles. The Bank of Japan maintains a wait-and-see approach and has no plans to raise interest rates for now, which had previously provided good support to the the yen. Strong growth in bank lending also contributed to increased demand for the yen.


USDJPY Pending Short at 146.32In this idea, I have plotted all the necessary information on the chart itself. But allow me to point them out in words:
1. A resistance zone drawn with a rectangle that shows 5 red down arrows, out of which 4 are historical price rejection points and the last one is an expected rejection point at the top of the resistance zone which will be our short entry.
2. An Elliott Wave count update that shows a double combination wave 2 showing that we are now in a C wave of the double combination Y wave.
3. 3 different trendlines: The purple is expected to break, the blue is where price is expected to be rejected that will coincide with the top of the resistance zone, and the green which will be our stop loss if break above.
4. A take short position risk-reward plot where SL is set is initially set up at 147.187 but this should really be following the green trendline, and a TP that is initially set at the blue H&S neckline at 141.042 (see previous USDJPY idea for the big picture H&S plot).
Overall, I am expecting a final push for USDJPY to move up that will be in-line with the equity markets last leg up) and then a higher degree wave 3 down for USDJPY that will also be in-line with equity markets downturn.
Good luck!

Usdjpy|| — the next move could be explosiveUSD/JPY
Timeframe: 2H
Strategy: Elliott Wave + Triangle Pattern + Fair Value Gap (FvG)
Formation: Contracting Triangle – Wave (a) to (e)
Risk-Reward: High Conviction Setup
Status: On the verge of breakout
🔍 Technical Breakdown:
The chart shows a classic contracting triangle pattern with completed internal waves (a)-(b)-(c)-(d)-(e).
Price is reacting near wave (e), signaling a potential bullish breakout.
A clean Fair Value Gap (FvG) zone lies just below current price — possible last dip before the breakout surge.
Target zone = 148.874, derived from the triangle's height projected from breakout point.
Strong confluence with liquidity hunt below before expansion move.
🎯 Target: 148.874
🛑 Stop Loss: Below 142.738 (SI Level / structural low)
🟢 Entry Trigger: Breakout above trendline + retest confirmation or Smart Money entry at FvG
This setup aligns with Elliott Wave triangle theory, often seen before sharp impulse waves. Smart Money is likely filling orders in the FvG zone before the upward expansion.

USDJPY Analysis Today: Technical and Order Flow !In this video I will be sharing my USDJPY analysis today, by providing my complete technical and order flow analysis, so you can watch it to possibly improve your forex trading skillset. The video is structured in 3 parts, first I will be performing my complete technical analysis, then I will be moving to the COT data analysis, so how the big payers in market are moving their orders, and to do this I will be using my customized proprietary software and then I will be putting together these two different types of analysis.

USDJPY: Pullback From Support📈USDJPY responded well to the highlighted intraday support zone on a 4H timeframe.
The price formed a double bottom pattern on that and violated its horizontal neckline.
There's a strong likelihood that the price will continue to rise and hit the 146.00 resistance level.

USDJPY Tests Channel Support After ADP Shock — Rebound Ahead?In the last hour's candle after the ADP Non-Farm Employment Change Index was released, USDJPY ( FX:USDJPY ) started to fall, but considering the position of this pair, I think we can have a good Risk-To-Reward even if the Stop Loss (SL) is touched.
USDJPY is trading near the lower line of the ascending channel and the Support zone(143.870 JPY-143.430 JPY) .
From an Elliott Wave perspective , USDJPY appears to be completing a corrective pattern .
I expect USDJPY to rise at least to the Potential Reversal Zone(PRZ) .
Note: Stop Loss = 143.220 JPY
Please respect each other's ideas and express them politely if you agree or disagree.
U.S. Dollar/Japanese Yen Analyze (USDJPY), 1-hour time frame.
Be sure to follow the updated ideas.
Do not forget to put a Stop loss for your positions (For every position you want to open).
Please follow your strategy and updates; this is just my Idea, and I will gladly see your ideas in this post.
Please do not forget the ✅' like '✅ button 🙏😊 & Share it with your friends; thanks, and Trade safe.

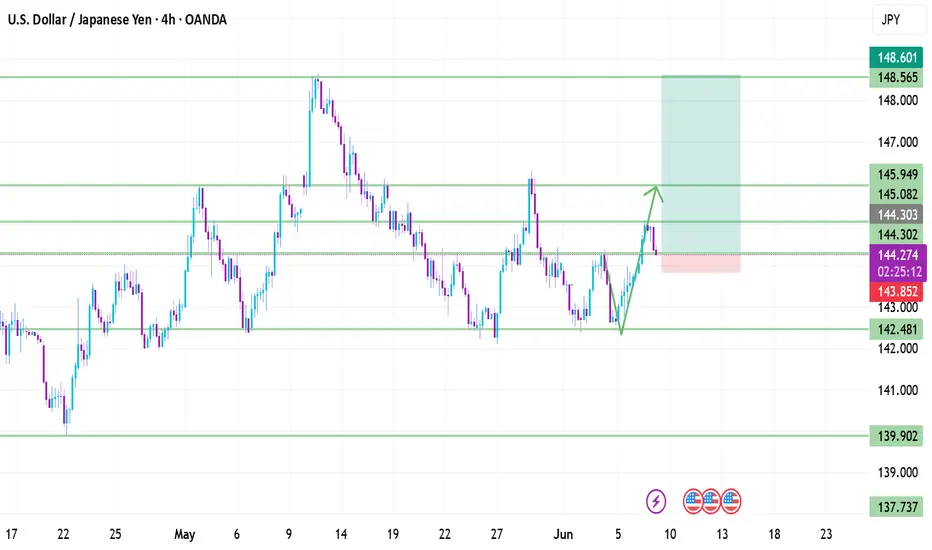
DeGRAM | USDJPY retesting the resistance level📊 Technical Analysis
● Four consecutive higher-lows off 140.9 have carved a rising flag that presses the channel roof (144.8); flag depth projects to the April swing-top/ Fib cluster at 147.8 once 145 is cleared.
● Daily RSI holds above 50 and price is now trading back above the broken wedge-cap (142.9), confirming it as demand and tilting risk toward the 150.9 macro ceiling.
💡 Fundamental Analysis
● US 2-yr yields stay >4.70 % after solid ISM-services prices, while BoJ minutes show members preferring “patient” normalisation; the widening policy gap keeps yen funding pressure intact.
✨ Summary
Long 142.9-144.0; break of 145 targets 147.8, stretch 150.9. Bull view invalidated on a daily close below 140.9.
-------------------
Share your opinion in the comments and support the idea with like. Thanks for your support!

USDJPY TRADING ROADMAP 09 - 13 JUNI 2025📈 USDJPY TRADING ROADMAP
Trading Plan & Market Outlook
The USDJPY pair is currently in a bullish phase and is expected to continue rising toward the Supply Zone between 146.765 – 147.664, as long as price action holds above the key Demand Zone at 142.273 – 141.426.
🔹 Trading Plan:
Primary Trend: Bullish (price heading to supply zone)
Demand Zone (Support): 142.273 – 141.426
→ This zone acts as the trend validation and risk threshold
Supply Zone (Resistance): 146.765 – 147.664
→ Potential target zone for bullish continuation
Risk Management:
As long as price stays above 141.426, the bullish outlook remains valid.
A break below this level may signal a shift in market direction.
📌 Key Notes:
Wait for price action confirmation near zones before taking entry.
Use proper position sizing and risk-reward ratios.
⚠️ DISCLAIMER ON
This content is for educational purposes only and does not constitute financial advice.
Trading involves substantial risk and may not be suitable for all investors.
Always do your own research and use appropriate risk management.

Trading Signals for USD/JPY sell below 146.41The price test at 144.06 coincided with the moment when the MACD indicator had just started moving downward from the zero line, confirming a correct entry point for selling the dollar. As result, the pair plunged toward the target level of 143.39.
Yesterday was marked by significant fluctuations in the currency market, triggered by the release of disappointing data from the United States. The ADP employment report showed a much smaller job increase than expected, and weak ISM services sector figures created a domino effect, leading to a rise in the Japanese yen and a corresponding decline in the US dollar. The market's reaction was swift. Concerned about slowing US economic growth, traders began shedding dollar assets and shifting into traditional "safe-haven" currencies like the yen. This process was further intensified by revised expectations regarding the Federal Reserve's future monetary policy.
Today's weak wage growth data had little impact on the currency market. It appears that market participants had already factored such results into their forecasts, expecting a correction after previously more optimistic reports. Overall, investors are currently focused on more significant indicators of economic health, such as inflation and GDP growth, rates.
Closing out the week Reports:
U.S. nonfarm payrolls report for May 2025.
This economic indicator provides insight to jobs added or lost in the economy, excluding farm workers, private household employees, and non-profit organization employees.
Policymakers pay close attention as it reflects the labor market and can influence decisions related to monetary policy.
The forecast is about 130,000 jobs with unemployment rate around 4.2%
With our last report was 177,000 and the forecast being 130,000 could signal weakness or consolidation if target is exact or lower.
Price is currently testing this week's high of 114.396 which is near our key resistance of 114.784 it might test that before the report is released but if not, I expect more consolidation until 8:30am.
Targets:
Buy: open and close above 114.784
Sell: open and close below 143.282
With the news coming soon be aware that price is sensitive to this report and based off the numbers we could see a move where price isn't subject to much consolidation between the target areas.
please be sure to lock in profits from my last trade.

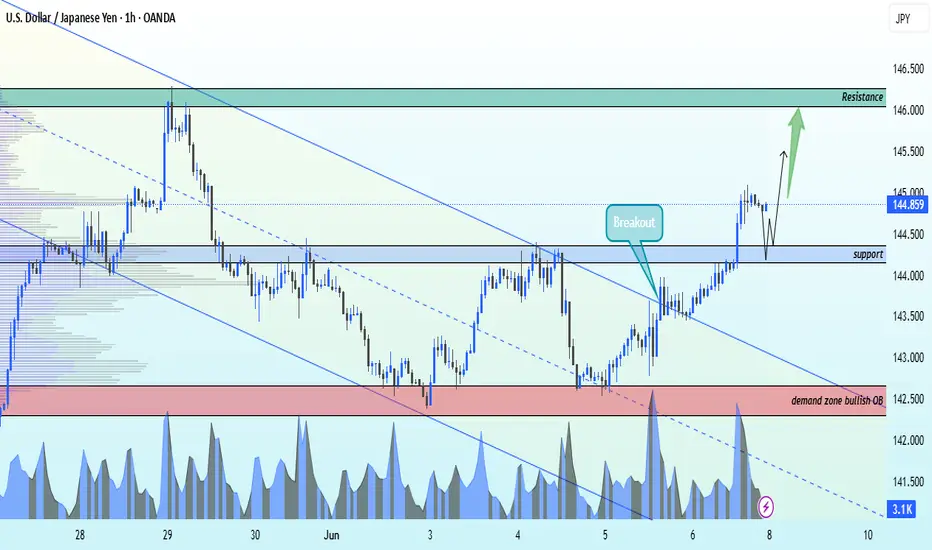
USDJPY has breakout the descending channel bullish strong nowFX:USDJPY Alert – Bullish Breakout in Play!
1H Timeframe | Descending Channel Breakout
📈 Entry: 144.300
🎯 Target 1: 146.000 (Key Resistance)
🛡️ Stop Loss: 142.700 (Demand Zone / Bullish OB)
After a clean breakout above the descending channel, USDJPY is showing strong bullish momentum. Price action confirms a potential move toward the next resistance level.
🔍 Technicals are lining up. Risk managed. Eyes on the prize.
✨ Like, Follow, Comment & Join us for more real-time setups and updates!
📊 Let’s trade smart. Let’s trade together.
#USDJPY #ForexTrading #BreakoutSetup #TechnicalAnalysis #LiviaTrades 😜📉📈
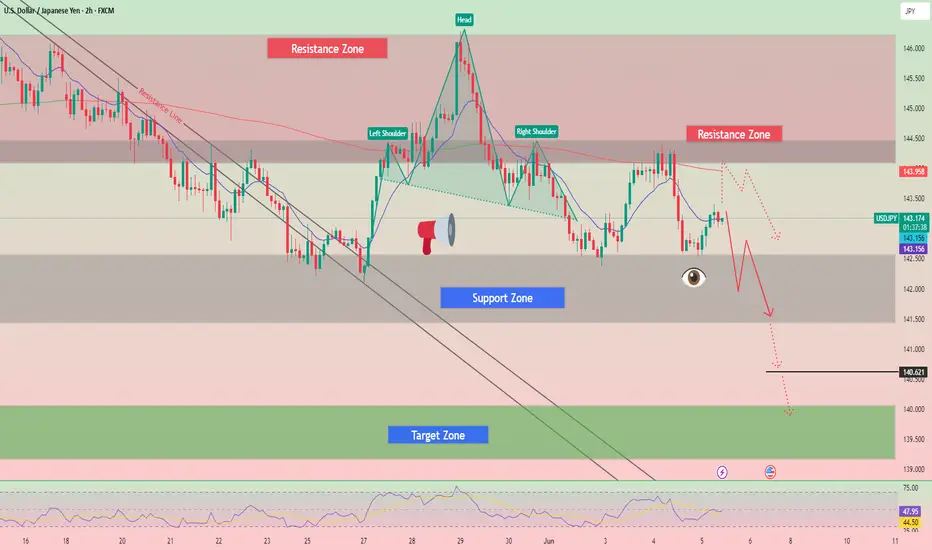
USD/JPY) breakout bearish trand analysis Read The captionSMC trading point update
Technical analysis of the USD/JPY (US Dollar / Japanese Yen) pair on a 2-hour timeframe. Here's the idea behind the analysis:
---
Overall Idea: Bearish Move Toward Support
---
Key Levels
Resistance Zone (Yellow Box, Top): Marked with two red arrows — shows strong price rejection around 146.00–147.00 area.
Support Zone (Yellow Box, Bottom): Around 139.85, marked as a target point and support level.
These two zones form the range in which price has been reacting.
---
Current Price Action
Price is currently trading at 142.649, well below the 200 EMA (at 144.190), which is a bearish signal.
It has broken below the mid-range and seems to be heading toward the lower support zone (139.85).
---
Trend & Structure
The price is following a downward trend after rejecting from the resistance zone.
The channel suggests a further leg down is likely to complete a measured move.
A temporary retest of the broken trendline might occur before continuation down.
---
RSI (Relative Strength Index)
Currently around 31.83, nearing oversold territory, indicating the potential for:
A short-term bounce before further downside, or
A reversal near the key support zone.
---
Projection
The projection arrow (blue) suggests a bullish rebound from the 139.85 support zone.
This aligns with a potential buy opportunity once support is confirmed.
Mr SMC Trading point
---
Conclusion (Trade Idea Summary)
Short-Term Bias: Bearish
Medium-Term Setup: Look for a buy opportunity around 139.85, if price reacts well.
Key Steps:
1. Watch for price to reach 139.85.
2. Look for bullish reversal patterns or confirmations at that level (e.g., bullish engulfing, RSI divergence).
3. If confirmed, a potential long trade could target back toward the 144–145 zone.
Please Support boost this analysis )

USDJPY is Nearing an Important ResistanceHey Traders, in today's trading session we are monitoring USDJPY for a selling opportunity around 143.700 zone, USDJPY is trading in a downtrend and currently is in a correction phase in which it is approaching the trend at 143.700 support and resistance area.
Trade safe, Joe.

Who wants to join the shorting party? Come onboard now..USDJPYWe have a nice retracement now and the risk reward is also good......
For beginners, again, I wouldn't suggest increasing your position size unless you have a clear profit target to get out. This is volatile pair where one moment you can see nice profits in your account and the next hour , it turns red. It is not the exit nor the entry that I believes create the anxiety but rather the unfinished business of having the money in your pocket.
There, you see profits rising and your fear increases by the minute to ask you take it or else.......and on the other hand, you worry, what if it goes down lower and you missed this opportunity. Every single day, this situation happens and some make money initially only to return back to the market. They then took revenge and bet more only to lose even more until they torn and battered, decides trading is not for them.
I suggest the minimum contract size you can trade with and start from there and learn as you see the price goes up and down. See what it does to your emotions - like riding a roller coaster. You imagined what you can do with the profits had you times 10 but you did not or wished it wasn't a demo account but real live account. Or you hesitated to enter and then it went up like a rocket and you sighed a relief, how lucky/good you were in spotting the market trend.
Trading on a different level reveals your true self much like a mirror and you can be honest about it or continues to fake it. It is up to you!
USDJPYPotential swing trade incoming ( Short )
- creating LLs and LHs
- Hitting daily supply line
- 3rd touch off the downwards trendline
- high wick candles on the lower time frames - sellers are stepping in
- SL just above previouse LH
- TP at major demand zone
- overall downwards trend within the market
boost and comment away guys i want to here your take on this trade

USD/JPYMy initial bias was to short USD/JPY; however, the pair has since formed a double bottom pattern, indicating a potential bullish reversal. It has broken through a key resistance level at 144.300. I am now waiting for confirmation of a successful retest of this level before considering a long position.

USD/JPY Higher-Low, 142.50 DefenseUSD/JPY continues to exert force on the USD and the past week was no different. Despite an open door for sellers, a higher-low showed with a hold of the same 142.50 support level that was in-play a week prior. That price traded early on Tuesday (Monday night in the states) and then on Thursday (Wed night in the U.S.) buyers came in to hold the low just above that price, illustrating a degree of bullish anticipation.
Reports of slowing pace of bond tapering from the BoJ, and perhaps even smaller reductions to the banks bond buying helped to soften long-term Japanese yields: 40 year JGBs made a move towards the 3% marker after skyrocketing up to 3.7% just a few weeks ago. That helped JPY-weakness to continue against the USD and USD/JPY is back to re-testing the 145.00 handle in the pair.
This remains a key component if a USD turn is nearby, but interestingly working with that turn may be more attractive against the Euro in a pair like EUR/USD as USD/JPY has continued to show traps on both sides of the market for much of 2025 trade. - js
