EURUSD Buy to High and reversal SellsPrice is currently close to a BB POI. When price tags our POI, the buy activates which we believe to take price to the previous high of 1.1570. A failure to break the previous high gives us an opportunity to sell from the OB POI via Quasimodo reversals at 1.14863.
Candlestick Analysis

NEARUSDT Retracement and BuysIf price fails to break the High, then a retracement is sure which will push price to our entries. Let's explain. We have two POI the first from the bottom is a Breaker Block (BB) and the second is a Order block (OB).
Now, if the price fails to push below the POI that begins at 2.327, then the BB will serve as an entry for our buy with SL placed below the POI.
However, If price invalidates the BB, then there will be a further push to the last POI beginning at 2.151 where our OB will serve as the entry for another buy. However, I am optimistic about the BB serving as the entry after the pushback.
NB: This is just an analysis and in now way a prediction of how the market will move.

Gold is expected to fall below 3300, continue to short gold!Fundamentals:
1. Pay attention to whether the geopolitical conflicts escalate, including the situation between India and Pakistan, Russia and Ukraine, and the situation between the United States and Iran, etc.
Technical aspects:
Although the gold price gradually rebounded after hitting 3320 points, the current rebound momentum is relatively weak. The gold price has turned from strong to weak, and the short-term "M"-shaped top structure formed by 3435 points and 3414 points above has suppressed the upward space of the gold price. Therefore, we still focus on shorting gold after the rebound. First, we focus on the resistance area of 3355-3365 points above. If the gold price rebound fails to successfully break through this area, the gold price will fall again and is expected to continue to fall to around 3280 points.
Trading strategy:
Consider shorting gold after gold rebounds to the 3355-3365 area, target price: 3340

USDJPY Set to Rise as Support Holds and Dollar Finds TailwindsUSDJPY looks poised for further upside following a period of consolidation and a successful retest of strong support around the 140.50 level. The weekly chart reveals a clear triple bottom pattern, reinforcing the strength of this support zone and suggesting renewed bullish momentum.
The US Dollar is starting to regain strength after a period of weakness, supported by improving U.S. economic data, sticky inflation, and a less dovish stance from the Federal Reserve. In contrast, Japan is unlikely to change its ultra-loose monetary policy in the near term, keeping rate differentials wide and favoring a stronger Dollar.
With the Bank of Japan expected to hold rates steady for the foreseeable future, capital is likely to continue flowing out of the yen. Carry trade flows remain intact, adding to the upward pressure on USDJPY.
Momentum indicators are turning higher, and price action is forming a steady base for another leg up. The market could target the 150 zone in the coming weeks, where the 50-week moving average may act as initial resistance.
As long as 140.50 holds, dips could offer attractive buying opportunities. A sustained move above 145.00 could trigger fresh bullish momentum and accelerate gains.

NZDCHF SHORtsEntry at Daily AOi
Weekly Rejection At AOi
Previous Weekly Structure Point
Daily Rejection At AOi
Previous Structure point Daily
Around Psychological Level 0.50000
H4 Candlestick rejection
Levels 6.98
Entry 95%
REMEMBER : Trading is a Game Of Probability
: Manage Your Risk
: Be Patient
: Every Moment Is Unique
: Rinse, Wash, Repeat!
: Christ is King.

Nifty Analysis EOD - May 9, 2025 - Thursday🟢 Nifty Analysis EOD - May 9, 2025 - Thursday 🔴
🧨 Gap Down, Rebound & a Triangle Trap – Bulls Show Spine Amid Chaos
Opening Mood:
Overnight panic from geopolitical tensions shook the market’s foundation—but the bulls weren’t ready to surrender just yet.
🧭 Nifty Summary:
Gift Nifty had plunged to 23,760 late last night on news of escalating conflict—marking a 445-point fall. However, as the night wore on without further developments, markets began to stabilize. At the open, Nifty registered a gap-down of 338 points at 23,935, but the first 5-minute candle showed strength, racing to fill the gap.
After a brief attempt to break the Previous Day’s Low (PDL), Nifty failed to hold below and slid back to its origin. The rest of the day was a tug-of-war with sharp two-sided moves, eventually forming a descending triangle pattern—a sign of compression and directional indecision.
🕯️ Daily Candle Breakdown:
Today’s Candle: Wide-range doji with upper wick—signs of volatility and hesitation
Close: 24,008 (▲ Positive)
Key Observations:
✅ Above 24,000 Psychological Mark
✅ Held Support Zone: 24,000 ~ 23,950
✅ Above Recent Swing Low: 23,847.85
❌ Slightly Below Previous Week’s Low: 24,054.05
❌ Below Previous Swing Close: 24,036
What It Implies:
Buyers are stepping in at key supports, but conviction is still lacking. The market remains reactive to global cues, especially Mission Sindoor ones.
⚔️ Gladiator Strategy Update
Strategy Parameters:
ATR: 291.20
IB Range: 204.00 (Large IB)
Market Structure: ImBalanced
Trade Highlights:
Total Trades: 1
✅ Long Trigger @ 10:10 AM → Target 1:1.5 Achieved
📈 Intraday Walk (5-Min View):
Strong gap-fill in the first candle signaled bullish intent
Failed breakdown below PDL trapped weak shorts
Descending triangle emerged as price compressed
Market closed near resistance but above key support—neutral to slightly bullish tone
🔮 What’s Next?
This market is walking a tightrope between sentiment and structure. On one hand, technical levels are being respected—but on the other, global uncertainty is keeping participants hesitant.
“This is a news-driven market. Delivery trades are best avoided. Stay nimble, trade the levels, and protect capital. Remember, sometimes staying out is a profitable strategy.”
🔍 Support & Resistance Levels
🔼 Resistance Zones:
24,036 ~ 24,044
24,150 ~ 24,165
24,188 ~ 24,240
24,290
24,330 ~ 24,365
24,400 ~ 24,420
🔽 Support Zones:
24,000 ~ 23,950
23,935
23,890 ~ 23,870
23,848
23,820
23,710 ~ 23,660
📌 Final Thoughts:
“Structure is key. When levels work, respect them. When they break, adapt.”
In a market full of noise, discipline and level-based action is your edge.
✏️ Disclaimer
This is just my personal viewpoint. Always consult your financial advisor before taking any action.

ExhaustedThe long red candle indicates an overbought market. Despite the good economic results no new highs could be reached and the week showed beginning profit taking. Most of the market participiants are long and convonced of the good results. They are right and many of them are sitting on good profits. The more profit taking will come in here they will be thinking of taking an increasing part of their profit.
f this is true the chart picture will show a double top and a beginning bear market in the shorter time frame.

#BTCUSDT. Is ready for a retest of 103.98 and higher.Structurally, over the next few days it looks like an attempt by the First Cryptocurrency to adjust its recent growth with a small correction into the zone of 92000-90200 - near these levels one can look for setups for buying.
Near these zones there may be an attempt to buy back at 103.98.
It looks promising, we are watching.

Ethereum Future: Limited Upside Ahead?Ethereum price dropped roughly 25% since April 2 due to an overall market crash following Trump’s tariffs implementation.
Compared to the almost 40% drop back in February after the first tariff announcement, this time the correction wasn’t as harsh or brutal.
So what can we expect next from Ethereum in the coming weeks?
The main hope for ETH price remains the upcoming Pectra upgrade.
Historically, major Ethereum upgrades have acted as bullish catalysts — for example, ETH roughly doubled in price ahead of both the Merge and the Shanghai upgrade.
If history rhymes, we could see a similar pre-upgrade pump this time too.
However, even if that rally materializes, I expect it to be limited to the $3,000–$3,400 range. The market lacks the kind of momentum or macro tailwinds needed to push ETH beyond 4k in this cycle — unless there’s a major shift in sentiment.
Overall, I remain cautious. The broader crypto market seems to be rolling over, and Ethereum hasn't even reclaimed its ATH.
With the next bear cycle approaching, long-term bullish targets might need to be revised — at least for now.
Short-term bounce possible thanks to Pectra hype, but don’t expect miracles. ETH likely capped below 3.4k unless something big changes.

Bitcoin’s Make-or-Break Moment: Eyes on $70KBitcoin price almost reached the $74k support area, which is critical for the bull run continuation.
This zone has acted as a strong resistance in the past, and a clean bounce from here could signal renewed strength and confidence in the market.
However, if this support fails to hold and BTC closes the weekly candle below the $70k level, it would likely mark the end of the current bull phase and signal the beginning of a distribution phase or even the early stages of a new bear market.
That doesn’t necessarily mean Bitcoin will crash straight to $50k — corrections are rarely that linear. But it would drastically reduce the chances of seeing new all-time highs in this cycle.
The next rally, if it happens, would probably be more muted and shorter-lived.
Hopefully BTC will manage to avoid this scenario and hold above the support area.
On the positive side, if BTC holds above $70k and we see strong demand stepping in, it could set the stage for a healthy bounce and continuation of the uptrend.
Still I expect that BTC will test 70k level and if we see strong buying pressure on that level we can expect some recovery.

Gold head and shoulders bottom trend, bull market strong?🗞News side:
1. Tariffs push up inflation and slow down the economy, and the Federal Reserve may be in trouble
2. The situation between India and Pakistan escalates again
📈Technical aspects:
At the hourly level, today's Asian session continued the "wash-out" operation characteristics, quickly rising by 20 US dollars at the opening, and then stepped back to 3310 to confirm the top and bottom conversion support level. The two positive lines seemed to form a "yang-enclosing-yin" upward attack pattern, but suddenly reversed, not only breaking the trend support line of 3280, but also falling to 3274 before bottoming out and rebounding. This erratic trend has a significant long-short double kill effect for investors accustomed to trend continuation strategies. However, we can accurately find the right position in the market to trade and make profits.
At present, it is expected to form a "head and shoulders bottom" pattern from a morphological perspective, accumulating momentum for subsequent rises, and there is still room for upside in the short term. At present, any pullback is an opportunity for us to go long. Pay attention to the 3360-3370 line suppression on the top. If this resistance area is broken, it may open up a new round of upward space.
TVC:GOLD FOREXCOM:XAUUSD FXOPEN:XAUUSD TVC:GOLD FX:XAUUSD OANDA:XAUUSD

Gold is in shock again, will the short position continue?🗞News side:
1. Tariffs push up inflation and slow down the economy, and the Federal Reserve may be in trouble
2. The situation between India and Pakistan escalates again
📈Technical aspects:
Gold experienced a big plunge yesterday, and today it bottomed out near 3275 again and then started to rebound. The current gold price is caught in a wide range of fluctuations, with long and short positions frequently alternating to impact the market, making it difficult to form a unilateral trend. At present, the gold price once rebounded to around 3330. If the gold price breaks through the 3336 line, short-term trading in the European market may touch the upper level near 3350, or even the 3365 line. Today's market cannot chase the rise and sell the fall. Overall, it is still a wide range of fluctuations. It should be a violent roller coaster before the subsequent surge. The European session relies on the low point of 3310 to step back as a defense, focusing on the upper 3350-3360, and further close the key resistance of 3370. The short-term focus below is the support of 3280-3290.
If you agree with this view, or have a better idea, please leave a message in the comment area. I look forward to hearing different voices.
OANDA:XAUUSD FX:XAUUSD FXOPEN:XAUUSD FOREXCOM:XAUUSD TVC:GOLD

Start buying goldTechnical aspects:
Gold has bottomed out and rebounded after a rapid decline today. It has now stood above 3330. When gold breaks above 3330, it has to some extent broken away from the technical repair structure and began to tend to a bullish pattern in terms of form. Although gold is currently under pressure in the 3350-3360 area, as the center of gravity of gold moves up, the support below has gradually moved up to the 3325-3315 area. So I think there is still room for gold to rise, and it may continue to rebound to the 3345-3365 area.
Trading strategy: Consider going long on gold in the 3330-3320 area, TP: 3345-3365

Golden stage low area: 3285-3275!Fundamentals:
1. Focus on Trump's dynamics and tariff-related issues;
2. Pay attention to whether geopolitical conflicts will escalate, including the situation between India and Pakistan, Russia and Ukraine, and the situation between the United States and Iran, etc.
The current expectation of interest rate cuts has declined, and the tariff storm has cooled down. At the same time, the market is betting on a further trend correction, which may cause capital outflows from the market, which will further hit gold bulls!
Technical aspects:
As I expected in my previous article, gold is expected to fall below 3300. Sure enough, gold has shown signs of falling below 3300. In the current structure, gold may further extend to the 3280-3270 area, which is also an important support area of primary concern in the short term; and as gold fell sharply, the market was bearish, and short-term resistance also moved down to the 3315-3325 area.
Trading strategy:
1. Consider the shorting opportunity after gold rebounds to the 3315-3325 area, TP: 3300-3290
2. Consider the longing opportunity after gold falls to the 3285-3275 area, TP: 3300-3310

1st PublishPatience is key in trading. I'm waiting for confirmation on EUR/USD. What would your setup look like?

GBPAUD: 2 Strong Bearish Confirmations 🇬🇧🇦🇺
GBPAUD is in a very bearish price action after a test
of the underlined horizontal resistance.
The price formed an inverted cup and handle pattern
and violated its neckline and a support line of a rising
parallel channel on an hourly time frame.
Probabilities will be high to see a decline at least to 2.064 support.
❤️Please, support my work with like, thank you!❤️

DOLLAR INDEX (DXY): Bullish Reversal Confirmed?!
Dollar Index formed an inverted head and shoulders pattern on a daily.
Its neckline breakout is a strong bullish reversal signal.
The broken neckline of the pattern turns into a significant support now.
We can expect a growth from that at least to 101.25 resistance.
❤️Please, support my work with like, thank you!❤️

USDJPY: Pullback From Resistance 🇺🇸🇯🇵
There is a high chance that USDJPY will retrace
from the underlined blue resistance cluster.
As a confirmation signal, I spotted a double top pattern
on that on an hourly time frame.
Closest support - 145.1
❤️Please, support my work with like, thank you!❤️
I am part of Trade Nation's Influencer program and receive a monthly fee for using their TradingView charts in my analysis.

LODHA - Bearish due to forming double Top pattern
TECHNICAL INDICATORS -
DOUBLE TOP PATTERN formation -
NSE:LODHA has formed a double top pattern indicating strong downward pressure for the stock
Double top is characterized by two consecutive peaks on a price chart, with a dip or low between them & subsequent breakout
VOLUME SPIKE -
the stock has recently shown two large volume spikes indicating strong upcoming momentum for the stock
Generally volumes increase before a significant price movement
SHOOTING STAR candlestick -
the stock has formed a shooting star candlestick recently indicating trend reversal for it ie from upward movement to downward movement
Shooting star is characterized by a small body at bottom and a long upper shadow of a candlestick
GAP-DOWN BREAKOUT -
the stock has broken out of the pattern with a gap-down indicating very strong downward pressure
PROFIT TARGET -
1200
STOP LOSS -
1325

Dxy bullish idea for next week - MMBMThis is a bullish possibility for DXY price action for next week.
Monthly:
- Price took a swing low confluent with a bearish breaker in discount and closed above the level;
Weekly:
- Price Took a swing below monthly swing with a bullish reaction. If this week closes with above previous weeks high, it confirms a bullish weekly swing;
Daily:
- Monday printed the likelly low of the week
- A daily fair value gap is open allow with a volume imballance around monday open signalling bullish price action - a retrace to these levels would be a good buying opportunity.
4h:
- there is a market maker buy model in play.
- as of now, price already printed an intermidiate term low signalling that low risk buy myght have happened.
News forecast:
- I expect NFP to either retrace price to daily fvg or daily volume imbalance and leave a bullish reaction.
- FOMC next week might bring the volatility to complete the mmbm
Thank you for reading

No BREAKDOWN! Yet to decide the trend! As we can see despite the break it managed to close inside the structure and hence still the indecision remains in view as till it sustains either side of the structure, no directional move can be expected but gaps can be created due to war like situation leading to sluggishness in the market so plan your trades accordingly and keep watching

AUDCAD SHORT Market structure bearish on HTFs DW
Entry at both Daily and Weekly AOi
Weekly Rejection at AOi
Previous Weekly Structure Point
Daily Rejection At AOi
Daily previous Structure point
Around Psychological Level 0.89500
H4 Candlestick rejection
Levels 5.41
Entry 95%
REMEMBER : Trading is a Game Of Probability
: Manage Your Risk
: Be Patient
: Every Moment Is Unique
: Rinse, Wash, Repeat!
: Christ is King.


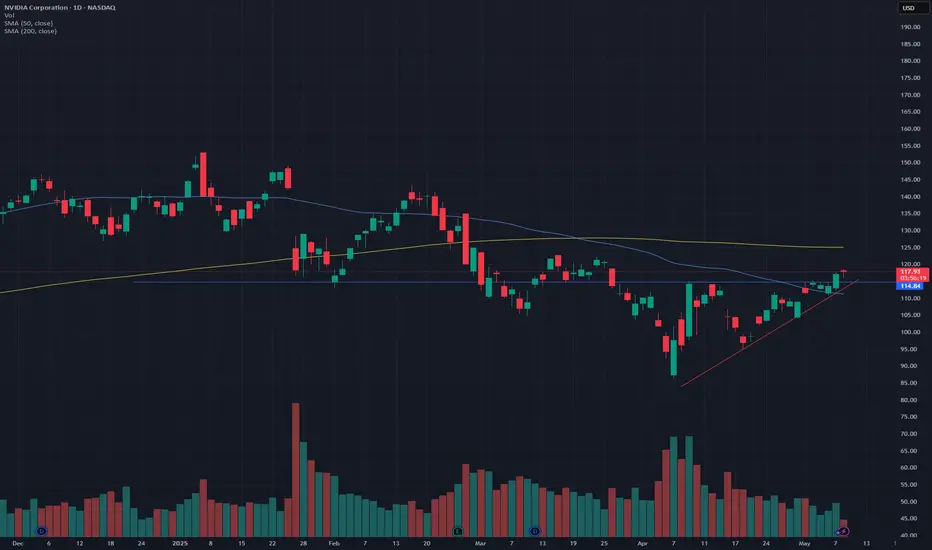
NVIDIA: Breakout above ascending triangle, retest confirmationNVDA has been forming an ascending triangle over the past few weeks, with declining volume. Finally, it broke out yesterday, and today, we had a retest of the resistance line. NVDA was down about 1% earlier today however after a successful retest of the resistance line, it is now up 0.8% at the time of writing.
In terms of support, it seems the price has successfully bounced off the 50-Day SMA line. While an ascending triangle is bullish, the 200-Day SMA is likely going to be a point of resistance (around $125).
This is amid the renewed overall market strength and the news related to the reduced limitations of exporting AI chips - which is contributing to the momentum.
Please note: Not financial advice.