GOLD MARKET ANALYSIS AND COMMENTARY - [May 19 - May 23]During the week, OANDA:XAUUSD fluctuated strongly, falling from $3,292/oz to $3,120/oz and then recovering to $3,202/oz. The main reason was that the US and China reached a trade agreement, according to which the two sides agreed to significantly reduce tariffs from May 14, creating positive sentiment for the market.
This week’s gold sell-off was the steepest since mid-June 2021, even steeper than the drop after Donald Trump’s election victory in November 2024. President Trump said there are currently about 150 partners who want to negotiate trade with the US, but the US cannot handle them all at once. In the next 2-3 weeks, the US will announce the export tax rates that partners will have to pay when selling to the US market.
The Trump administration will impose specific tariffs on partners that have not yet negotiated with the US, at what level, has not been specifically announced. If the new tariffs remain as high as the initial list of reciprocal tariffs, there is a risk that many partners will retaliate, making the tariff war hotter, pushing gold prices up sharply. On the contrary, if the new tariffs are much lower than the initially announced tariffs, gold prices may only increase moderately, then continue to adjust.
After the recent sharp sell-off, profit-taking sentiment is still dominating the market. However, safe-haven demand remains strong due to geopolitical tensions that have not yet ended and concerns about a global economic recession.
📌The gold price trend next week is likely to fluctuate in the range of 3,055 - 3,270 USD/ounce, with a slight decrease scenario being preferred due to profit-taking pressure and the potential recovery of the USD. However, if there is a positive signal from the Fed policy or increased geopolitical instability, the gold price may recover to the range of 3,260 - 3,270 USD/ounce. Investors need to closely monitor economic data and geopolitical fluctuations to make appropriate decisions.
Notable technical levels are listed below.
Support: 3,162 – 3,100 USD
Resistance: 3,228 – 3,250 – 3,292 USD
SELL XAUUSD PRICE 3271 - 3269⚡️
↠↠ Stop Loss 3275
BUY XAUUSD PRICE 3054 - 3056⚡️
↠↠ Stop Loss 3050
Fundamental Analysis

XAUUSD H4 OUTLOOK – “Bounce, Trap or Breakdown?🧠 Market Context:
Gold is consolidating between a major bullish defense zone (3090–3110) and multiple bearish supply layers above. We remain below the last major lower high and within a bearish H4 flow, though macro HTF structure is still bullish. If 3090 fails, the next deeper demand blocks will be critical.
🔁 STRUCTURAL FLOW:
Bias: Bearish ST | Bullish HTF
Trend: Lower highs | Weak demand bounces
Flow: Retesting internal supply | Reaction from demand confirmed
📍 SNIPER ZONES
Type Price Range Description
🔴 Extended Premium Supply 3365–3380 HTF OB + imbalance + wick zone
🔴 Premium Reversal Block 3312–3325 Upper imbalance + internal LH supply
🔴 Mid-Term Supply 3275–3285 May 13 rejection zone
🔴 Internal Trap Supply 3240–3255 Retest of old OB + inefficiency
🟢 Reactive Demand Zone 3160–3172 Internal CHoCH + RSI confluence + bounce base
🟢 HTF Buy Block 3090–3110 Final CHoCH origin + strong rejection
🟢 Deep Discount Demand 3050–3072 Unmitigated WICK OB below liquidity
🟢 FVG-Demand Layer 2980–3000 Weekly imbalance + final LTF liquidity pocket
🟢 Weekly Strong Low Zone 2890–2925 Last major HL before macro expansion
⚠️ Notes:
Above 3325, price would need a strong break in structure to flip bias short-term.
Below 3090, watch for bounce reactions at 3050 or the full discount zone into 2980.
Until then, internal traps are likely during news week flow.
🔥 Follow @GoldFxMinds for sniper updates and market recaps
🧠 Which zone do you expect to be hit first: 3380 or 3050? Drop your thoughts below 👇

XAUUSD – Weekly Outlook | May 19–23, 2025“Sniper Zones Reloaded – Gold Pullback Season or Just a Tease?”
🔍 Macro View:
Gold just closed a massive -3.6% weekly candle off the top at 3435 — a clear sign of rejection from a premium exhaustion zone. After weeks of uninterrupted bullish madness, we finally have signs of cooling. But is it the start of a deeper correction or just Friday’s fade?
➤ Dollar Strength picked up again after UoM Sentiment miss + sticky inflation expectations.
➤ FOMC minutes (Wed) + Unemployment Claims (Thu) = the potential catalysts for the next impulsive leg.
🔄 Weekly Market Structure:
✅ BOS to the upside still valid – no CHoCH printed yet on W1
📍Current candle printed a clear top wick rejection after liquidity sweep
🕳️ Internal structure on LTFs is bearish – signaling potential deeper pullback
🧭 Key Weekly Zones (Sniper-Ready):
Zone Type Price Range Description
🔻 Supply #1 3435–3465 Premium FVG top + rejection wick
🔻 Supply #2 3285–3320 Imbalance left behind on the last push up
🔻 Sell Zone 3210–3240 Mitigated OB, possible retest
🟩 Buy Zone #1 3095–3120 Weekly FVG + Fibo 38.2 retrace
🟩 Buy Zone #2 2980–3030 Unmitigated demand block, old resistance turned demand
🟩 Buy Zone #3 2850–2890 Weekly CHoCH zone & deep Fibo retrace
📈 Fibonacci Extensions (from last major HL–HH):
FE 100% = 3435 ✅ hit
FE 127% = 3580 (remains next upside target IF retracement holds at key support)
FE 161.8% = 3720 (only if we reclaim 3435 cleanly)
🔺 Weekly Bias:
Short-Term: Bearish pullback (especially early week if no bullish LTF CHoCH)
Mid-Term: Bullish continuation still valid if 3090–3120 holds
🧠 Key Notes:
Expect trap zones and tricky NY opens if no clean confirmation
3210 = likely re-entry point for bears if price retraces
3090–3120 = key defensive line for bulls; invalidation of this = possible slide to 2980
If 3435 gets swept again with strength and closes above → bullish continuation unlocked
🧨 High-Impact Risk Events – This Week
📅 Thu, May 22
📉 Unemployment Claims – 2:30pm
📊 Flash Manufacturing & Services PMI – 3:45pm
🏠 Existing Home Sales – 4:00pm
📅 Fri, May 23
📊 New Home Sales – 4:00pm
📑 FOMC Financial Stability Report (tentative)
📌 Gold Weekly Outlook – “Sniper Zones Reloaded 🔫”
After weeks of pure bullish momentum, gold finally showed signs of exhaustion with a clean weekly rejection from the premium zone.
Is this the start of a real pullback? Or just another fakeout to shake out retail before continuation?
We’ve mapped the structure:
🟥 3435 is the stronghold
🟩 3090 is the battlefield
With Unemployment Claims, PMIs, and housing data lined up this week, expect volatility — but don’t force entries.
Trade light. Stay patient. Let the sniper setup come to you. 🎯
🔥 Like & Follow @GoldFxMinds for sniper-level breakdowns
💬 Drop your bias below — correction or continuation? 👇

Price broken above the swing low for a reversal. USDJPYSo I can see price and risen above the low which tells me a strong buy sentiment is coming. Wait for retracement to take out the imbalance and test trend line and support line. After which it should reverse and go up. Taking it to the previous high and area of resistance. Let's see how this plays out next week!

SPX : Where Where - according to the F
This is a continuation of the previous SELL idea. This time, we go into the details, where we can actually see price action moving in lock-step.
Lets make lots of money. Please keep the SL tight.
Good luck.

3 Reasons Arista Networks Could Soon Rally SignificantlyIn 2023, we covered Arista Networks NYSE:ANET , calling it part of the internet’s "bedrock" but rating it a Hold due to valuation concerns. Since then, ANET has outperformed the S&P 500, proving our call wrong.
Recently, ANET’s stock has dipped alongside broader market declines. However, we believe the selloff presents a buying opportunity, given ANET’s strong positioning in AI and cloud growth. Here’s why:
1. Strong Growth Drivers
ANET’s revenue comes from three segments: Core (65%), Cognitive Adjacencies (18%), and Cognitive Network (17%). Its hardware (Ethernet switches, routers) and software (EOS) are critical for hyperscalers (48% of revenue), enterprises (35%), and providers (17%). With AI and cloud capex surging, ANET is well-positioned for sustained demand.
2. Best-in-Class Margins
ANET’s net margins have nearly doubled since 2020, reaching ~42% TTM. Operating leverage allows revenue growth to flow efficiently to the bottom line. While R&D spending must remain competitive, ANET’s high-margin business supports strong earnings.
3. Attractive Valuation
Despite premium multiples (14x sales, 35x earnings), ANET trades near 5-year lows relative to historical trends. If growth (projected ~20%) and margins hold, a re-rating toward its average P/E (~40x) could drive shares toward $100+.
Risks
- Customer concentration (Meta + Microsoft = 35% of revenue).
- Margin pressure if R&D spending lags.
- Multiple compression in a weak market.
Verdict: Buy
ANET’s growth, margins, and valuation make it compelling. While risks exist, the upside outweighs them.
Good luck out there!

Gold Spot Price Breaks Downtrend: Bullish Momentum Towards 3,250Gold Spot against the U.S. Dollar (15-minute timeframe) shows a prevailing downtrend, highlighted by a descending channel (blue) and a series of lower highs and lower lows. Yellow circles indicate key resistance points along the trendline, while the red downward arrow suggests a potential continuation of the bearish movement.
However, the chart also hints at a potential rebound toward the 3,250 USD target, as indicated by the dotted path. Key support levels are marked around 3,100 USD. The analysis suggests that breaking the resistance could signal a shift in trend, while holding within the channel may indicate further declines. Traders should watch for confirmation signals before taking positions.

Is XRP the Next Crypto Rocket?$2,5 Breakout Targets $3.5 or moreI see a clear setup with actionable insights. The chart shows XRP forming a range and deviation at 1.77$, with a recent bullish breakout attempt. Here’s my breakdown:
Technical Analysis
Deviation of the global range points at potential consolidation(blue horizontal line)
Breakout Attempt: A sharp green candle pushed above the $2,36 resistance, but it’s yet to close convincingly above it. The red arrow projecting upward suggests optimism for a move toward $3–$3,5if the breakout holds.
Given today’s date (May 18, 2025, 03:40 PM EEST), this setup aligns with recent crypto market trends. XRP’s price action could be reacting to broader market sentiment, regulatory news, or Ripple-related developments, which have historically driven volatility.
This chart screams opportunity if the breakout holds. However, watch for a false breakout—crypto is notorious for shakeouts. A failure to close above $2,5 could see price retrace to $2,3 or lower. I’d monitor the next 2-3 weeksfor confirmation.

NZDJPY: A Bigger Bearish wave could start SoonNZDJPY: A Bigger Bearish wave could start Soon
NZDJPY broke out from a bearish Wedge Pattern during Friday thus rising the chances to decline more.
The Rising wedge pattern is formed during a bullish trend. As long as the pattern was broken out the chances for a bearish trend is growing.
NZDJPY may face a strong support near to the structure areas where it can also change direction.
Targets:
🎯 84.50
🎯 83.50
🎯 82.50
You may find more details in the chart!
Thank you and Good Luck!
❤️PS: Please support with a like or comment if you find this analysis useful for your trading day❤️
Disclosure: I am part of Trade Nation's Influencer program and receive a monthly fee for using their TradingView charts in my analysis.

DXY CorrectionMy vision where going price next week.
Question is does wave B finnish already or not.
Monday we will see about Wave B going higher or price move down to wave C.
TA show down but FA talk that dollar must rise.
Area 100.3 is trend zone
For my opinion bearish correction continue.

Is a Rally Starting, or Is Another Trap Being Set?
Markets Have Been in the Green for 2 Weeks – But How Long Will It Last?
Over the past two weeks, the cryptocurrency markets have shown clear signs of recovery. Bitcoin even touched the $105,000 mark, while altcoins have begun to bounce back. Social media is once again echoing with “the bull is here” chants. Traders are rushing into long positions, fueled by green candles and fresh hope.
But let’s ask the tough question:
Is this truly the beginning of a bull market—or just another “bait rally” inside a much larger downtrend?
What Has Happened Since March 2024?
Since March 2024, altcoins have suffered massive losses—on average, between 85% and 90% from their previous highs. Many investors didn’t just lose profits—they lost a significant portion of their initial capital.
Now here's the painful truth: If a coin has dropped 90%, it needs to rise 900% just to return to breakeven. In financial recovery, the math is never symmetric.
Losses come easy and linear. Recovery is exponential, and often elusive.
Summer Season: The Historical Pattern
Let’s get real: how many true bull markets have ever started during the summer months?
Almost none. Historically, summers in the crypto world have meant low liquidity, lower volumes, and more consolidation or downtrends.
So, what makes this year different?
This brief green period might feel exciting—but is there real structure behind it, or is it simply a cleverly timed “buy-in lure” before the next leg down?
Why CMA Technologies Never Falls for These Traps
Here’s the good news: At CMA Technologies, we’ve never built algorithms that chase emotional momentum or seasonal noise.
We don’t try to predict markets. We listen to them. We measure. We respond. Our systems don’t act on green candles—they act on probability and mathematical precision.
We don’t care when a trend begins. We care when it ends, and we act accordingly.
Have we continued to profit? Yes. But why? Because we trade with math, not with emotions.
What’s Your Strategy?
Markets are green. People are euphoric again. But what is the architecture behind this rally?
If you zoom out, these two-week surges often prove to be nothing more than rest stops in a larger downtrend.
At CMA Technologies, we don’t respond to sentiment—we respond to data. And that’s the difference.
Conclusion: Bull Market or a Setup for the Next Fall?
I'd love to hear your thoughts in the comments. Some things never change. But systems that are built on math—they only get stronger with time.
👇 💬 Do you believe this rally is real? Or just another summer trap? 🧠 Drop your insights below

Consolidation Before the Next Big Move?The price is sitting close to a support level at $0.00001405, which has held strong lately. The Relative Strength Index (RSI) sits at 57, showing decent buying pressure but not overbought yet, while the 50-period moving average at $0.00001430 acts as a floor beneath the price. If SHIB breaks above $0.00001500 with confidence, it could climb toward $0.00001600. But if it falls below $0.00001405, the next stop might be $0.00001320.
What’s Driving SHIB Right NowOn the news front, Shiba Inu’s ecosystem is buzzing, especially with Shibarium, its layer-2 network, hitting over one billion transactions recently. Despite this milestone, SHIB’s price hasn’t taken off, likely due to a cooling crypto market and some investors cashing out after a May rally. Big players (whales) are stacking SHIB, with noticeable token inflows, and the burn rate is picking up, which could make SHIB rarer over time.

Moody's downgrades US credit rating, will gold be affected?Information summary:
At about 4:43 pm on Friday (the last minute before the market closed), Moody's downgraded the US sovereign credit rating from AAA to Aa1 on the grounds of "surge in debt and fiscal out of control", ending the US's last "top credit" title among the three major rating agencies.
Perhaps considering reducing the impact, Moody's announced this news after the US stock market closed. But at this time, gold, foreign exchange and other markets still have more than ten minutes of trading time. The 10-year US Treasury yield once rushed from 4.44% to 4.49%, the US dollar index fell, and gold rushed up.
The downgrade is a super-class data, which may cause gold to rebound in stages, but not continuously. If nothing unexpected happens, after the adjustment, gold may continue to retreat in a trend.
Technical analysis:
Next week, gold may rebound in stages to 3330-3340. Then there may be a trend decline again, and I estimate that it may test around 2950 below. As for why it went to 3330-40, here is an analysis:
I think the current gold trend is very similar to the holiday trend in Asia from May 1st to 5th. It also fell sharply, then bottomed out and rebounded, and then stretched up again. I also drew it in the picture, which is basically consistent with the current trend. If the next market trend is copied from the previous paragraph, then I think it should test the 3330-40 point.

SUI/USDTSince the price broke above the 0.5 and 0.382 levels, and RSI is not yet severely overbought:
The next stop is likely the 0.236 Fibonacci level (~4.38).
If that level breaks, it could retest the swing high at 5.35.
Cup and Handle (bullish continuation pattern)
🔵 Cup:
The rounded bottom formation from the January 2025 dip (~$2.6) to the current retest of the $3.9 area resembles a cup.
The left side peaked around ~$3.5-$3.9, dipped to ~$2.2, and recovered gradually.
🔵 Handle (potential forming):
After reaching current resistance near $3.9–$4.0, price might consolidate sideways or slightly down to form the handle.
If it does this without breaking below $3.5, it strengthens the case.
⚠️ Alternative Possibility (if rejection happens):
If price fails to break $3.9–$4.4, it could:
Form a double top (bearish reversal), or
Fall back to support zones: $3.5 → $3.1 → $2.6

BTC 4H Chart Analysis - Bitcoin is currently moving within a range, and two potential demand zones are highlighted on the chart with green boxes. There's a possibility that BTC may pull back into one of these zones to collect buy-side liquidity before continuing higher.
These areas can be considered for long setups on the 15-minute timeframe — but only with a valid entry trigger.
---
📌 Key Levels
🟢 Supports:
- 100,000 – 100,500
- 97,400 – 98,700
- 95,900
🔴 Resistances:
- 104,800 – 105,200
- 105,900

Deposits All Commercial Banks & US DebtWhen a politician and their buddy start spouting nonsense about the US debt spiraling out of control, but then insist that tax cuts are great because they’ll create jobs, and all that money will somehow trickle down to the rest of us, magically boosting tax revenue to "make up" for the lost funds.
Especially when that same politician was re-elected bc inflation & the economy were just so horrible, promising he would come in and save the day bringing prices down again with more tax cuts because they worked so great the first time around.
That's the extreme right. What about the extreme left #MMT?
#MMT is just as bad as MAGAs! They will tell you deficits are great! Deficits add to our savings! Deficits make us all richer! It's accounting, they say! it has to be that way! Except for the little fact that it's not based on empirical evidence.
So the next time some B.S. Artist tells you their little version of a fictional money story, you will know what reality is since 2018. You will have seen this chart with your own eyes and cannot unsee it! No matter what you do, no matter what side you lean politically, it's irrelevant.
Public debt since the tax cuts have grown exponentially, while the private sector deposits have lagged to the point they have stagnated completely since 2021. Barely rising 6%.
Defunding CIA, FBI, USAID, Dept of Education etc.. will do absolutely nothing to make up for all the lost tax revenue since 2018 and the next tax cuts to follow. In fact, when we enter a recession, the deficits will explode even higher as tax revenues collapse and social and economic stabilizers (if there are any left) kick in. Then what?
Don't shoot the messenger!

DXY (Timeframe synchronization + BOS + Orfer Flow + Supply)Hello Traders!
Our previous supply was mitigated, now we have confirmation + supply zone, there we can expect reversal on LTF.
Have a profitable day and don't forget to subscribe for updates!

BITCOINBITCOIN could be seeing smart money after it returns to buying character floor and as long as price remains on that 3hr/4hr demand floor it crossed since 2024 and retested it,we will keep buy sentiment and hoping that 118-119k supply roof will be attended. On a flip side ,a break below that 3hr/4hr demand floor will visit 70k zone where we have a buy traps which the last touch was a double bottom and a bullish price action .break or swipe of the zone will be 50 k zone .
on weekly we have descending trendline break out which am expecting a retest on that zone.
#bitcoin #btc #crypto#analysis

XAGUSD[SILVER] : A Start Of Swing Sell, Comment Your Views?Silver is currently consolidating in the daily timeframe, with no clear indication of where the price may move forward. Looking at the volume of the last few days or week’s candles, we can confirm that a swing sell could be imminent in the market. Fundamentals and technical data support this view, as well as our own trading experience.
This analysis predicts the future price of the XAGUSD (SILVER) but does not guarantee that the price will move exactly as described.
However, we want to emphasise that this analysis should be used for educational purposes only and should not be considered as a secondary bias.
We would love to hear your thoughts on this idea.
Additionally, please remember to like, comment, and share the idea to encourage us to bring you more trading ideas!
Much love ❤️
Team Setupsfx_

The Countdown Has Begun… Discover This Week’s Market OpportunitiWeekly Analysis Report: May 19 – 23, 2025
Prepared by: Economic Expert Mohammed Qais Abdulghani
Introduction
Amid escalating global economic challenges and growing geopolitical risks, the need for a comprehensive and scientific understanding of market dynamics becomes increasingly critical.
In this weekly report, we present a holistic analytical outlook covering the major currency pairs, global commodities, indices, and cryptocurrencies — with gold taking center stage. We also highlight several educational technical setups based on precise data.
1. Key Economic Events This Week
The markets await a series of crucial economic indicators that may directly influence price action, including:
• Monday: Eurozone Consumer Price Index (CPI)
• Tuesday: Reserve Bank of Australia interest rate decision, Canada CPI
• Wednesday: UK CPI and US Crude Oil Inventories
• Thursday: US Jobless Claims, PMI figures, Existing Home Sales
• Friday: Germany’s GDP and US New Home Sales
2. Technical Analysis – Major Currency Pairs
• US Dollar Index (DXY): Remains under pressure below 102, with further declines toward 99, 96, and 94 possible.
• EUR/USD: Maintains bullish momentum above 1.1100, aiming for 1.1400 and potentially 1.2000.
• GBP/USD: Needs to break 1.3400 to resume an uptrend; otherwise, a drop toward 1.3100 is possible.
• USD/JPY: Faces strong resistance at 148.00; selling pressure remains dominant below this level.
• USD/CHF: Trading below 0.8400 supports potential declines to 0.8500 and 0.8700.
• AUD/USD: Under pressure below 0.6500, with targets at 0.6300 and 0.6000.
• NZD/USD: Approaching key support at 0.5800; a break below may lead to 0.5600 and 0.5400.
• USD/CAD: May regain positive momentum if it breaks above 1.4000, with further potential toward 1.4200 and 1.4400.
• GBP/JPY: Lacks momentum below 194.00, suggesting further declines to 190.00 and 186.00.
• EUR/JPY: Trading below 163.00; continued pressure may drive it toward 160.00 and 157.00.
• EUR/GBP: Facing downward pressure below 0.8500; a break of 0.8350 could push it to 0.8200.
• USD/TRY: Holding firm above 39.00, maintaining bullish potential toward 39.5 and 40.0.
3. Cryptocurrencies
• Bitcoin (BTC): Still below the key resistance of $106,000. A breakout may trigger a rally to $112,500, while failure to break higher risks corrections to $97,500 and $84,000.
• Ethereum (ETH): Facing bearish pressure after failing to break $2,700, with potential downside targets at $2,200, $1,800, and $1,400.
• Ripple (XRP): Weak below $2.40, with a bearish path toward $2.00, $1.60, and possibly $1.20.
4. Gold & Metals
• Gold (XAUUSD): Trading within a key technical range. A breakout above $3,260 may resume the bullish trend toward $3,400, $3,500, and $3,600. Conversely, staying below $3,100 could trigger a deeper correction.
• Silver (XAGUSD): Holding firm above $32.00, which is a launchpad for $34.00 and $36.00. A drop below could send prices back to $30.50 and $29.00.
5. Energy Markets
• Crude Oil (USOIL): Testing major resistance around $62.00. A breakout could lead to $66.00 and $70.00. Failure to do so might cause a retreat to $58.00.
• Natural Gas: Key support at $3.20. A breakdown may accelerate losses toward $2.50 and $2.00.
6. Global Indices
• Dow Jones (US30): Holding bullish momentum above 41,500, targeting 44,000 and 46,000.
• S&P 500: Stable above 5,900; continued momentum may lift it toward 6,300.
• Nasdaq: Stable above 21,200, enhancing the probability of a move to 22,800.
• Russell 2000: Approaching resistance at 2,120; a break may lead to 2,250 and 2,300.
• FTSE 100 (UK): Trading positively above 8,450, with targets at 8,750 and 9,100.
• DAX (Germany): Stable above 23,000, with upside targets at 24,100 and 25,600.
• CAC 40 (France): Maintaining upward momentum above 7,800.
• Nikkei (Japan): Consolidating above 37,000, targeting 39,000 and 41,000.
7. Weekly Trade Opportunities (Educational Analysis)
EUR/USD – 4H Chart
• Trade Type: Buy
• Entry Price: 1.11600
• Target 1: 1.12500
• Target 2: 1.14000
• Stop Loss: 1.10900
• Technical Insight: Price is trending above the ascending support with a clear rebound at 1.11000, supporting further upside.
Gold (XAUUSD) – 4H Chart
• Trade Type: Buy
• Entry Price: 3200
• Target 1: 3260
• Target 2: 3400
• Stop Loss: 3100
• Technical Insight: Gold rebounded from strong support at 3100 within an ascending channel, supporting bullish momentum.
Crude Oil (USOIL) – 4H Chart
• Trade Type: Pending Buy
• Entry Price: 62.30
• Target 1: 66.00
• Target 2: 70.00
• Stop Loss: 60.00
• Technical Insight: Oil is testing horizontal resistance; a breakout may trigger a swift bullish wave.
Dow Jones (US30) – 4H Chart
• Trade Type: Buy
• Entry Price: 42435
• Target 1: 43500
• Target 2: 44000
• Stop Loss: 41500
• Technical Insight: The index remains in a bullish trend, trading above moving averages and reinforcing upward bias.
Bitcoin (BTCUSD) – 4H Chart
• Trade Type: Buy
• Entry Price: 104000
• Target 1: 106600
• Target 2: 112500
• Stop Loss: 100000
• Technical Insight: Bitcoin is holding above strong support at 103000, increasing the likelihood of upward continuation.
Conclusion
We invite all readers to engage with this report by sharing your thoughts, technical insights, and development suggestions in the comments section.
To enrich this professional dialogue, we pose this week’s interactive question:
Do you believe gold will break the $3,260 level this week? Or will the corrective scenario prevail?
Your participation adds value to the discussion and helps enhance the quality of content for all market enthusiasts.
Prepared by: Economic Expert Mohammed Qais Abdulghani

Why Traders Chase — and Always LoseHard truth:
You don’t miss opportunities. You chase noise.
Let’s break down the real reason you keep “missing moves”:
1. FOMO is not urgency — it’s confusion.
When you enter because “everyone’s talking about it,” you’re not trading a setup. You’re reacting to social proof.
2. Volatility ≠ opportunity.
Big moves look attractive, but if they’re not in your plan — they’re distractions, not trades.
3. The market rewards patience, not activity.
Every click, every chart, every refresh feeds your dopamine — not your edge.
🚫 Solution?
Stop scanning. Start filtering.
Use tools that prioritize structure over noise. That’s why we built TrendGo — to give clarity in chaos and help you avoid traps masked as opportunity.
📌 Don’t chase. Build your edge.

GBPJPY → Return to range. Possible price decline.FX:GBPJPY is forming a local bearish trend amid a correction in the dollar. The price is returning to the range and entering strong resistance.
Amid a correction in the dollar, the Japanese yen is strengthening, putting pressure on the currency pair.
GBPJPY is returning below a strong level (within the range) and consolidating in the selling zone, which could trigger a continuation of the decline towards areas of interest. Technically, the global trend is neutral and the currency pair is forming a rebound from strong downward resistance. If the bears keep the price below 193.45 - 193.74, the local downward trend may continue.
Resistance levels: 193.45, 193.74, 194.22
Support levels: 193.04, 192.35, 191.65
Price consolidation below 193.74 - 193.45 will confirm that bears are holding the range resistance. The sell-off may continue, and in this case, the price will head towards the indicated zones of interest and liquidity.
Best regards, R. Linda!

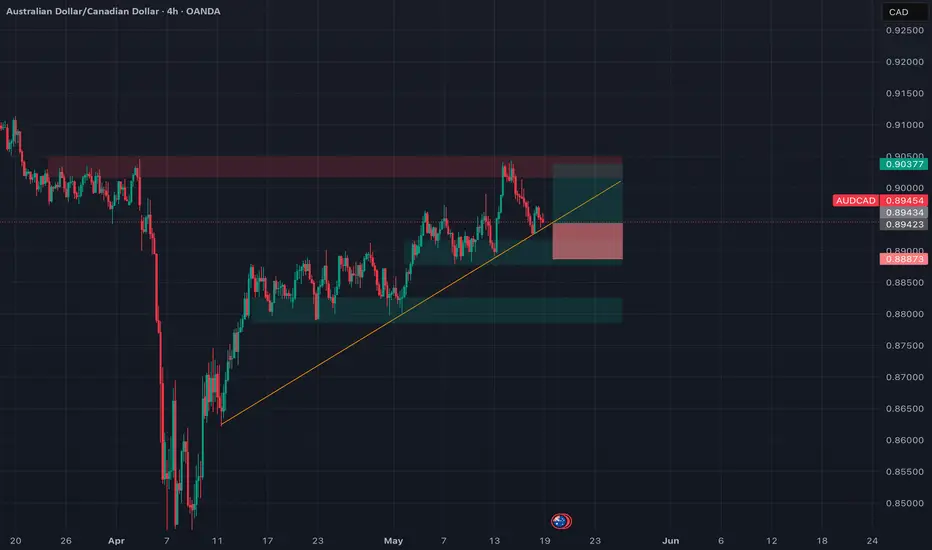
AUDCAD Long: Riding Aussie Strength vs Weak Loonie 🔹 Pair: AUD/CAD
🔹 Timeframe: 4H
🔹 Direction: Long
🔹 Strategy: Trend Continuation + Macro Confluence
🔹 Trade Active: 📍 0.8945 (CMP)
📊 Fundamental Bias
🇦🇺 AUD – Bullish
• Seasonal Surge: Historically strong from May 19 to June 10.
• Conditional Score Gain: AUD rose from 21 → 24 (momentum improving).
• Macro View: Inflation stabilizing, dovish stance offset by improving sentiment.
• VIX < 20: Risk-on conditions favor AUD.
🇨🇦 CAD – Bearish
• Flat Conditional Score: No improvement (2 → 2).
• Hawkish CB but Weak Data: CPI softening, trade risks persist.
• Global Sentiment: Oil stagnation + cautious BoC tone = headwinds for CAD.
⸻
🧠 Confluence Summary
✅ AUD macro + seasonal strength
✅ CAD remains fundamentally weak
✅ Risk-on supports commodity currencies
✅ 4H trendline support holding
⸻
🖼️ Technical Setup
• Entry: 0.8945
• Stop Loss: 0.8890 (below ascending trendline + support zone)
• Take Profit: 0.9036 (prior resistance + TP1)
• Risk:Reward: ~1.67
🟠 Optional Target: 0.9045 for extended move.
📌 Outlook
I’m bullish on AUDCAD for the week of May 19–23, supported by:
• Seasonal patterns
• Risk tone
• CAD stagnation
• Clear trend structure
Will look to trail SL as price closes above 0.8975. Clean invalidation below 0.8890.
⸻
💬 What’s your bias on AUD this week?
Drop a comment & let’s discuss 📉📈