USD/JPY - H1 - Channel Breakout (17.05.2025) The Pair on the H1 timeframe presents a Potential Selling Opportunity due to a recent Formation of a Channel Breakout Pattern. This suggests a shift in momentum towards the downside in the coming hours.
Possible Short Trade:
Entry: Consider Entering A Short Position around Trendline Of The Pattern.
Target Levels:
1st Support – 142.40
2nd Support – 140.17
🎁 Please hit the like button and
🎁 Leave a comment to support for My Post !
Your likes and comments are incredibly motivating and will encourage me to share more analysis with you.
Best Regards, KABHI_TA_TRADING
Thank you.
Disclosure: I am part of Trade Nation's Influencer program and receive a monthly fee for using their TradingView charts in my analysis.
Fundamental Analysis

GOLD → Breaking of the downward trend structure...FX:XAUUSD is breaking out of the downward price channel and heading towards the zone of interest at 3346. A false breakout of resistance could trigger a correction before growth continues.
Gold is rising for the third day in a row and trading above $3,300 amid a weakening dollar and heightened geopolitical tensions. Investors are seeking refuge due to concerns about US fiscal policy, trade disputes with China, and a possible Israeli strike on Iran. Gold is also supported by expectations of a Fed rate cut and weak prospects for the dollar.
Technically, the price is heading towards the order block and resistance at 3345-3360. Since the opening of the session, the price has exhausted all its potential, and a retest of the key level may end in a false breakout and correction. However, based on the fundamental background, gold's growth may continue after the correction...
Resistance levels: 3346, 3360, 3409
Support levels: 3288, 3265, 3245
Gold has returned to the buy zone, but the fundamental background is unstable, and any weakening of economic risks could send gold back south. At the moment, the focus is on 3346-3360, with a false breakout likely to trigger a correction.
Best regards, R. Linda!

Analysis of BTC price prediction for 2025 to 2026Hello sexy friends, I hoping that you are very good and be successful in this market today.
Based on the released data bullrun not happened yet and market still collecting the liquidity for a big movement, don't worry this year will finishing very nice by a great momentum....I want to all of we can give a nice profit from the market.
This analysis based on pitchfan tools that BTC can gets to high levels consist of 3 tp that I think :
Tp1 : 108,000$ that reached successfully
Tp2: 160,000$ common soon...
To3: after correction will happening
Be patient 🙏 and wait
All Tim be successful.
Kiss 👄 😘 all of you.

Golden Cross? No Thanks!! Here’s How to Get In Early.📉 “Golden Cross? No Thanks. Here’s How to Get In Early.”
By FXProfessor
Everyone’s hyped about the Golden Cross again...
📰 “Bullish Signal!”
📈 “50 SMA crossed the 200!”
🎉 “Party time!”
Let me stop you right there.
If you’re waiting for that cross to go long —
You’re not late.
You’re definitely late.
The Golden Cross is a lagging indication.
It’s the afterparty. The smart money already had the drinks and left.
🔍 Here's the deal:
✅ Golden Cross forms after the move
✅ Price is usually already up double digits
✅ Sometimes it triggers right before a top
✅ Even EMAs (which I prefer) are still confirmation tools
✅ The real edge? Structure. Trendlines. Pressure zones.
📊 What I use instead:
-Custom EMAs that react faster
-My signature parallelogram method for early pressure
-Focus on trendlines and structure
-Above all — logic, not hype
- Fundamentals first!
For example, while the Golden Cross just printed, I was already watching $74,394 and $79,000.
Why? Because pressure builds before indicators react.
That's where the best entries live.
So next time someone posts
“Golden Cross confirmed!” 😏 Just smile and remember:
By the time the cross lights up, I’m already halfway to the next target.
Use EMAs if you like. But structure comes first.
That’s where the party starts.
One Love,
The FXProfessor 🧠📈
Disclosure: I am happy to be part of the Trade Nation's Influencer program and receive a monthly fee for using their TradingView charts in my analysis. Awesome people who care about the TRADER FIRST!

USDJPY:Is it a beginning of major bullish trend? Read CaptionThe price of USDJPY has shown a mixed volume, making it difficult to determine the trend. However, if we analyse the data, we can see that USD is gaining strength in the coming time. This could be due to the strong news coming in this week, which may divert the USDJPY towards the 150 price region. There are four potential targets that price could hit and surpass. Please use this analysis solely for educational purposes, as it does not provide any guarantees.
Good luck and trade safely.
Thanks for your support! 😊
If you’d like to help us out, here are a few things you can do:
- Like our ideas
- Comment on our ideas
- Share our ideas
Team Setupsfx_
❤️

GOLD → Short squeeze before a drop to 3150?FX:XAUUSD is consolidating. The market needs a driver, but due to the unstable fundamental background, traders have switched to a wait-and-see mode. Consolidation could turn into strong movement at any moment. But in which direction?
Gold under pressure: the market is waiting for signals from the Fed and negotiations. The dollar is putting pressure on the market amid expectations of trade negotiations with India, South Korea, and Japan, as well as statements from the Fed.Earlier, the metal was supported by the weak dollar after Moody's downgraded the US credit rating, but growing interest in risky assets and hopes for peace between Russia and Ukraine reduced demand for gold. Key factors — negotiations and comments from the Fed — will continue to influence the dynamics of the dollar and gold.
Technically, the price is in a downtrend and within consolidation. A breakout from consolidation could be accompanied by strong momentum, but I believe that there will be no countertrend movement and that a retest of resistance could end in a decline...
Resistance levels: 3265.5, channel resistance
Support levels: 3206, 3153
The most likely scenario within the bearish trend is a short squeeze and a downward breakdown from the triangle (the fundamental background and economic risks are slowly but surely declining, and gold may lose value). A false breakout of 3250-3265 could trigger a continuation of the trend towards 3150-3120.
Best regards, R. Linda!

Key Rejection Zone Approaching – Bearish Setup in PlayChart Summary:
Asset: Unspecified (USD-based)
Timeframe: Short-term (likely 1H or 4H)
Indicators:
EMA 50 (red): 3,245.772
EMA 200 (blue): 3,223.635
Key Zones:
Resistance Zone (Red box): ~3,310–3,360
Target/Support Zone (Red box): ~3,110–3,160
Mid Support Zone (Blue box): ~3,200–3,230
Trendline: Downward sloping resistance connecting major highs
---
Technical Breakdown:
Trend Analysis:
Primary Trend: Bearish ⬇️
Confirmed by the downtrend line (black) which has been respected multiple times (3 clear touches).
Current Price: 3,290.090
Price is approaching a key confluence zone: resistance area + trendline.
This area has previously acted as strong supply.
Moving Averages:
EMA 50 > EMA 200: Minor bullish signal (Golden Cross), but price action is still below major resistance.
However, this cross may be a false signal if price gets rejected here.
---
Price Action:
Current Move: Strong bullish push toward resistance after rebounding from the target zone ✅
The resistance zone and trendline are likely to act as a rejection point unless broken decisively.
---
Bearish Scenario (High Probability):
If price fails to break above the resistance zone:
Expect a rejection and move back toward:
Blue mid-support: ~3,220
Target zone: ~3,130 (major demand area)
Confirmation: Bearish candlestick pattern or strong wick rejections near resistance.
🔵 Entry Idea: Short near 3,310–3,350
🎯 Target: 3,130 zone
✋ Stop-Loss: Above 3,360 (above trendline + resistance)
---
Bullish Scenario (Less Likely):
If price breaks above the resistance zone with strong volume:
Could signal trend reversal
Next target levels: ~3,400+
---
Conclusion:
Bias: Bearish near resistance zone
Key Level to Watch: 3,310–3,360 (critical for direction)
Trading Approach: Wait for confirmation, don't preemptively short without rejection signals.

NZDJPY → Pre-breakdown consolidation. Readiness for a declineFX:NZDJPY is under pressure from a global downtrend. Locally, a flat (range) and pre-breakdown consolidation relative to support are forming on the chart...
After a false breakdown of support on May 16, the price failed to reverse and grow. Instead, the currency pair entered a consolidation phase, during which it continues to test support. Each subsequent retest of 85.25-85.30 only increases the chances of a breakout with the aim of continuing the decline. Another important nuance is the elimination (short squeeze) of local resistance at 85.95.
Pressure on the price is also being exerted by the falling dollar index, which is strengthening the Japanese yen, which is generally reflected in the price of NZDJPY...
Support levels: 85.300, 85.25, 84.195
Resistance levels: 85.7, 85.95
The continuation of the current consolidation and the compression of the price towards support only increases the chances of a breakdown of the 85.30 support level. A break and consolidation of the price below 85.25 could trigger a further decline.
Best regards, R. Linda!

XRPUSDT: Price has reversed, what's next? XRPUSDT has smoothly reversed from our designated reversal buy zone, as clearly pointed out in this chart and our previous analysis. We expect a smooth price reversal taking the price to $4 in the coming weeks. Please use accurate risk management while trading XRP. Crypto is likely to remain more volatile in the coming days.
Two targets are pointed out, which you can set based on your analysis.
If you’d like to contribute, here are a few ways you can assist us:
- Like our ideas
- Comment on our ideas
- Share our ideas
Team Setupsfx_🚀❤️

UJ Could Tumble Back To 140 If Bears Take Expanding RangeToday FX:USDJPY Sellers make a Breakout of the Rising Support of the Expanding Range it's been trading in since the Low that started the range back on April 22nd.
An Expanding Range is typically considered a Continuation Pattern suggesting that if Sellers can hold price under the Rising Support, we can suspect JPY to overcome USD in this pair pulling price down continuing the Downtrend it was in prior to entering the pattern.
Once the Breakout of Consolidation is Validated, a Breakout & Retest of the Rising Support could deliver potential Short Opportunities to take price down to the Low of the Range.
Fundamentally, there is a lot of worry about the fall out of Tariff Talks with important trade partners with the 90-Day grace period soon coming to an end, weakening labor market potentially signaling "Stagflation" and additionally, it is suspected that Trump's Tax Cut Bill could add $3 - $5 Trillion to the $36.2 Trillion debt the US is already suffering from, further harming the Dollar.
-https://www.tradingview.com/news/reuters.com,2025:newsml_L1N3RT018:0-dollar-on-defensive-as-traders-eye-trump-tax-bill-g7-currency-talks/
-https://www.tradingview.com/news/te_news:459470:0-dollar-extends-losses/

Cocoa Explosion Loading? Specs & Hedgers Agree🔍 Fundamental Analysis – Commitment of Traders (COT)
The latest COT report, dated May 13, 2025, reveals a strong bullish accumulation signal, with a significant increase in long positions across all major trader categories.
Specifically, Non-Commercials (speculative traders such as hedge funds and money managers) increased their long positions by +3,490 contracts while simultaneously reducing shorts by -467 contracts. This dynamic reflects renewed speculative confidence in the cocoa bullish trend.
Simultaneously, Commercials (typically producers and processors) added +5,187 long contracts and closed -661 short contracts. This is especially noteworthy, as commercials usually take the opposite side of speculators. Here, however, their alignment with speculators may indicate expectations of upcoming supply constraints or market stress.
Total open interest rose by more than +6,000 contracts, suggesting real capital inflow into the market rather than just rebalancing.
This alignment between speculators and institutional hedgers is rare and often precedes further price appreciation.
📈 Net Positions & Price Action
Looking at the “Net Positions & Prices” chart over the past year, it’s clear that Non-Commercial net positions are recovering after a notable drop in March and April. This reversal aligns with the technical bottom and the start of the current price rally.
Commercials, although still net short (in line with their historical bias), are reducing their bearish exposure, hinting at lower physical supply pressure or a need for hedging against further price increases.
Price action has reflected this narrative, surging higher following the April lows.
🕰️ Seasonal Analysis
Seasonality adds another layer to the analysis.
Historically, May tends to be flat or slightly bearish (10Y and 15Y averages), but the 2-Year seasonal line—which better reflects current market behavior—shows a strong bullish tendency starting mid-month. This supports the ongoing rebound and increases the likelihood of further upside in the short term.
Historical data also shows that June, while volatile, is often positive or neutral in shorter cycles.
📊 Technical Analysis
From a technical perspective, cocoa recently completed a strong bullish leg, rebounding from the 8,800–9,000 USD demand zone, identified as a clear area of institutional buying (evident through volume and impulsive candles).
The price then decisively broke through mid-range resistance levels and tested a key weekly supply zone between 11,200 and 11,500 USD, where it was initially rejected.
Currently, we are in a technical pullback, likely targeting the mitigation zone at 9,700–10,000 USD. This area represents a solid long entry opportunity if the market confirms a bullish structure on intraday charts (H1 or H4).
The RSI is near overbought, yet without divergence—suggesting the trend remains structurally bullish despite a natural correction.
🧭 Strategic Conclusion
Cocoa currently shows a rare convergence of bullish signals: supportive COT positioning, increasing net long interest, strong 2Y seasonality, and clear technical structure controlled by buyers.
However, after the recent sharp upside move, a correction to key support zones is likely before another bullish leg unfolds.

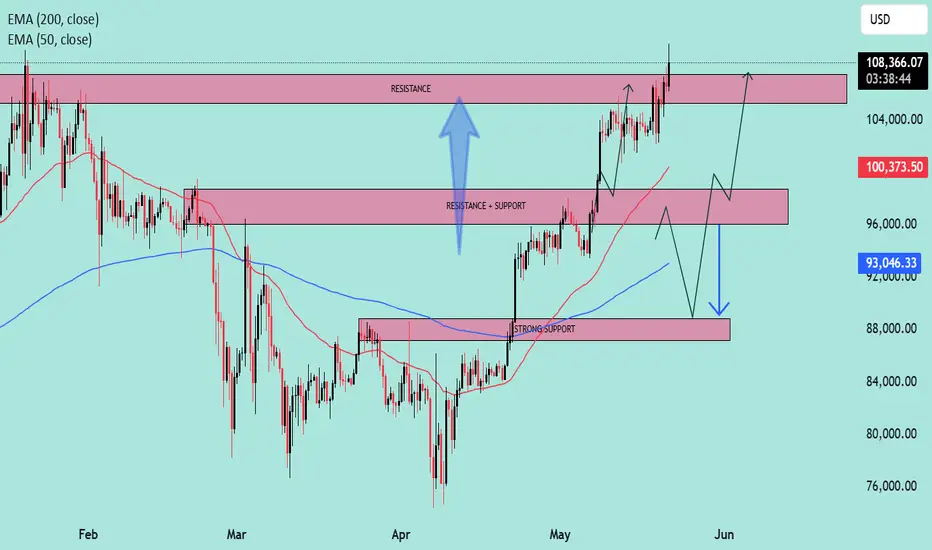
Technical Levels Respected – BTC Reaches $108K Target what next?📍 BTC Target Hit with Precision!
✅ As predicted in the previous analysis, Bitcoin has successfully tapped the $108K resistance zone — clean and technical execution!
📊 My chart spoke in advance... and the market listened.
🎯 Why miss out on these accurate forecasts?
📉 My strategies are not just random lines — they’re built on solid market structure, EMAs, and key price action zones.
📢 Let’s stay connected!
🧠 I’m committed to sharing educational content and professional trading insights to help you grow as a trader.
💡 Whether you're a beginner or seasoned trader, there’s always something new to learn with me.
📚 Join the journey — learn, trade, and win!
📩 DM or follow to get consistent updates and chart breakdowns.
🚀 Let’s trade smart, not hard!
Usd/Jpy intra-day Analysis 20-May-2025Disclaimer: easyMarkets Account on TradingView allows you to combine easyMarkets industry leading conditions, regulated trading and tight fixed spreads with TradingView's powerful social network for traders, advanced charting and analytics. Access no slippage on limit orders, tight fixed spreads, negative balance protection, no hidden fees or commission, and seamless integration.
Any opinions, news, research, analyses, prices, other information, or links to third-party sites contained on this website are provided on an "as-is" basis, are intended only to be informative, is not an advice nor a recommendation, nor research, or a record of our trading prices, or an offer of, or solicitation for a transaction in any financial instrument and thus should not be treated as such. The information provided does not involve any specific investment objectives, financial situation and needs of any specific person who may receive it. Please be aware, that past performance is not a reliable indicator of future performance and/or results. Past Performance or Forward-looking scenarios based upon the reasonable beliefs of the third-party provider are not a guarantee of future performance. Actual results may differ materially from those anticipated in forward-looking or past performance statements. easyMarkets makes no representation or warranty and assumes no liability as to the accuracy or completeness of the information provided, nor any loss arising from any investment based on a recommendation, forecast or any information supplied by any third-party.

EUROUSD COT and Liquidity Analysis chart The EUR/USD pair has demonstrated a convincing upward momentum, which might suggest a sustained long opportunity. However, traders should exercise caution—this bullish move could be a classic trap. Despite the current strength, signs of exhaustion are beginning to appear in the price action and volume. The market may soon shift direction, and a downward correction or full reversal could be imminent. Now is not the time to chase the high—stay alert, as the fall could happen sooner than expected.

Wolfspeed Inc. History chart 👌
Correction completed today in ending diagonal in small frames .
Target price = Massive high ( Long term 👌)

Fake Candle: Stop Getting Liquidated TodayA giant green candle pops up on your chart… You get excited, jump in — and boom, price dumps !
Fake candles are one of the market’s most psychological traps .
This breakdown shows how to avoid getting tricked — and even profit from them!
Hello✌
Spend 3 minutes ⏰ reading this educational material.
🎯 Analytical Insight on Dogecoin:
Dogecoin has posted an impressive 60% rally in recent weeks and is now testing the key psychological resistance at $0.25. A confirmed breakout from this level could unlock at least 22% further upside , aligning with a breakout above the descending channel toward the $0.28 target. Key daily support, Fibonacci confluence, and a rising trendline are also in play. 📉🚀
Now , let's dive into the educational section,
🧠 The Psychology Behind Candle Traps
It all starts when the market shows a sudden sharp move. A strong bullish candle — full of hope — shows up out of nowhere. But guess what? Most of the time, it’s just bait.
Smart money loves this moment — when retail traders think a moonshot is coming.
So never trust the candle’s look alone. Look deeper for confirmation.
🛠 TradingView Tools to Catch Fake Candles📊
practical tools inside TradingView that help detect false signals.
Set these up and test them live in your charting flow:
Volume Profile
Shows you where volume is really happening. No volume = no trust.
Session Volume HD
Reveals hidden session volume. If a big candle has weak session volume, that’s a red flag.
Relative Volume (RVOL)
Tells you if current volume is above/below normal.
Fake candles often come with volume mismatch.
Candle Close Timer
Shows how long until a candle closes.
Wait for that close — fake candles often flip last minute.
Multiple Timeframe Analysis
Check higher TFs before trusting the move.
Many fake candles trick you in low TFs.
Apply these directly inside your TradingView layout — it’s a game changer.
🔍 Real Candle vs Fake Candle
A real candle usually forms at a key support/resistance level with solid volume.
A fake one? Often pops up in a random zone, low volume, and before higher timeframes confirm.
Pro tip: Wait for the candle to fully close — then check if volume + structure supports the move.
📉 Rookie Mistake Alert
New traders often jump in on the first big candle they see.
Why? Because they want to be “early” and catch the move.
But in markets, patience wins — not speed.
Follow footprints, not fireworks.
🎯 Three-Step Filter For Fake Candles
Here’s your anti-fake-candle checklist:
No volume? No entry!
Confirmation over assumption. Use indicators like RSI, divergence, or MAs.
Always check the higher timeframe. Low TF = high deception.
🔄 Market Makers Love These Games
Fake candles are a classic weapon for market makers.
They know exactly when emotional traders will FOMO in.
These aren’t just candles — they’re emotional traps.
Study the trap, not just the move.
🧩 Final Takeaway & Suggestion
Fake candles aren’t just technical — they’re psychological .
Use the right tools, wait for confirmation, and don’t let your emotions lead .
Start your next analysis with a mental filter , not just a visual one.
always conduct your own research before making investment decisions. That being said, please take note of the disclaimer section at the bottom of each post for further details 📜✅.
Give me some energy !!
✨We invest countless hours researching opportunities and crafting valuable ideas. Your support means the world to us! If you have any questions, feel free to drop them in the comment box.
Cheers, Mad Whale. 🐋

The Invisible Hand in Crypto: Are We Just Puppets?You think you’re trading based on your analysis?
Maybe you’re just thinking that.
The crypto market might be far more controlled than you realize — here’s how, when, and why .
Hello✌
Spend 3 minutes ⏰ reading this educational material.
🎯 Analytical Insight on Ethereum:
Following its impressive recent rally, ETH continues to show strength, supported by high volume and a clear bullish market structure. A key daily support—confluent with the Fibonacci zone and an ascending trendline—remains intact. My main target stands at the psychological $3,000 level, implying ~16% upside potential if momentum sustains. 🔍
Now , let's dive into the educational section,
📊 TradingView Tools: Decoding the Minds of the Whales
In a market where price moves often feel pre-scripted, precision tools aren’t a luxury — they’re survival gear. TradingView offers indicators like Accumulation/Distribution, On-Balance Volume, Smart Money Concepts, and Liquidity Heatmaps that help you spot where big money is entering or exiting . These tools, especially on higher timeframes, can reveal underlying accumulation or distribution before major moves happen. For instance, if OBV rises while price remains flat, whales might be silently building positions. Also, indicators like Whale Alerts, based on on-chain analysis, can show large transactions often tied to upcoming volatility. Combine this with tools like Volume Profile or classic trendlines, and you’re no longer chasing price — you’re anticipating it.
🎯 Collective Behavior or Whale-Orchestrated Moves?
Markets — especially crypto — haven’t moved on simple supply and demand for a long time. Many of the price spikes or dumps you see aren’t organic; they’re orchestrated. Big players with massive volumes steer liquidity to where they want it.
🧠 Retail Psychology: A Weapon in Bigger Hands
Why do you always enter after a pump? Why does the market bounce right after you panic sell? These are not coincidences. Fear and greed are weapons. Smart money knows exactly how to trigger emotional trades from retailers, turning those reactions into their profits.
🔄 The Recycled Trap Scenarios
Here’s a classic: sudden green candle to trigger FOMO, followed by a slight dip, more retail buys in, then a sharp dump — liquidity collected. If this sounds familiar, it’s because it keeps happening. Those who spot it early survive.
📉 It’s About Liquidity, Not Your Support Line
Whales don’t care about your trendlines. They care about liquidity. If you know where most long or short positions are placed, you can often predict the next market move. TradingView indicators help identify liquidation zones — follow them.
🕹 You’re Just a Pawn — Unless You Learn the Map
If you’re just reacting candle by candle, you’re losing. But when you start thinking like whales, understanding their setups, you flip from pawn to player. Sentiment tools, volume flow, and behavioral indicators are your way out of the trap.
📌 Final Words
If you thought your analysis was behind your trades — think again. Smart money plays by a plan, and TradingView’s tools help you see the blueprint. Don’t be manipulated — learn to move like the movers.
always conduct your own research before making investment decisions. That being said, please take note of the disclaimer section at the bottom of each post for further details 📜✅.
Give me some energy !!
✨We invest countless hours researching opportunities and crafting valuable ideas. Your support means the world to us! If you have any questions, feel free to drop them in the comment box.
Cheers, Mad Whale. 🐋

GBPUSD: Will DXY Bounce Back? |GBPUSD Swing Sell|The GBPUSD pair is currently rallying towards a potential selling zone, where sellers could push the price down. However, the main concern is the current state of the DXY, which clearly indicates another sell-off and could lead to another lower low. Please remember to use risk management while trading forex pairs.
There are three take-profit targets that can be set according to your trading plan. This analysis doesn’t guarantee that the price will move as described.
Good luck and trade safely!
Thank you for your unwavering support! 😊
If you’d like to contribute, here are a few ways you can help us:
- Like our ideas
- Comment on our ideas
- Share our ideas
Team Setupsfx_
❤️🚀

USDJPY TRADE PLAN – MAY 21 BIG BREAKOUT AHEAD?USDJPY TRADE PLAN – MAY 21 | FED HAWKISH BUT YEN STAYS WEAK – BIG BREAKOUT AHEAD?
USDJPY is entering a critical technical zone as the market weighs the Fed’s persistent hawkish stance against Japan’s passive approach to the Yen’s depreciation. After a strong rally, we are seeing a potential exhaustion with key levels in play.
🌍 MACRO CONTEXT:
FED remains hawkish: Officials continue to support higher-for-longer interest rates to tame inflation → USD remains firm.
Bank of Japan silence: No signs of FX intervention or rate policy shift, causing ongoing weakness in JPY.
Risk sentiment neutral: Risk-off flows are muted; USDJPY remains trapped in a wide range – awaiting macro catalysts.
📊 TECHNICAL OUTLOOK (H2 CHART):
Price is now correcting within a falling channel.
Price broke below the MA200 and rising trendline, now retesting a key support zone at 143.77.
The current range 141.99 – 144.71 is critical – a breakout from either end may dictate the next medium-term direction.
🎯 TRADE SETUPS FOR TODAY:
✅ SCENARIO A – SELL THE RALLY (PRIMARY BIAS):
If price rejects 144.71:
SELL ZONE: 144.70 – 144.71
SL: 145.10
TP: 143.77 → 143.30 → 142.50 → 141.99
→ Key resistance area – price may trigger strong seller interest.
✅ SCENARIO B – SELL ON BREAKDOWN:
If price breaks 143.77 and retests:
SELL ZONE: 143.60 – 143.70 (post-breakdown entry)
SL: 144.10
TP: 142.50 → 142.00 → 141.99
✅ SCENARIO C – SHORT-TERM BUY (LESS FAVORABLE):
If price reacts positively at 141.99 with bullish confirmation:
BUY ZONE: 141.90 – 141.99
SL: 141.50
TP: 142.50 → 143.00 → 143.77
→ Only take this setup if strong reversal signals appear.
🔑 KEY LEVELS TO WATCH:
Resistance: 144.71 – 145.00 – 148.44
Support: 143.77 – 143.30 – 141.99 – 141.20
📌 FINAL THOUGHTS:
USDJPY remains in a volatile consolidation zone, pressured by a hawkish Fed but lacking JPY strength. Watch for PMI data and Fed comments this week for directional cues. Until then, respect the current range and trade with discipline.
📣 Bias favors SELL from 144.71 unless buyers reclaim full control – trade the reaction, not the prediction!

Cardano-ADAUSD Periodic Analysis-Issue 82 (Free Access)The analyst believes that the price of ADAUSD will increase within the time specified on the countdown timer. This prediction is based on a quantitative analysis of the price trend.
___Please note that the specified take-profit level does not imply a prediction that the price will reach that point. In this framework of analysis and trading, unlike the stop-loss, which is mandatory, setting a take-profit level is optional. Whether the price reaches the take-profit level or not is of no significance, as the results are calculated based on the start and end times. The take-profit level merely indicates the potential maximum price fluctuation within that time frame.

NZD/USD TRADING PLAN – MAY 21 | RETEST OR CONTINUATION?NZD/USD TRADING PLAN – MAY 21 | RETEST OR CONTINUATION? 🔍
After several steady bullish sessions, NZD/USD is pulling back slightly from the 0.5961 resistance zone. The pair remains within a well-defined ascending channel on the H1 chart and is approaching a key support area around 0.5910 — a zone that could trigger a technical bounce and continuation of the current bullish trend.
🌍 MACRO CONTEXT:
The US Dollar Index (DXY) is showing signs of weakness following disappointing CPI and PPI data. This opens up room for commodity currencies like NZD to recover further.
Meanwhile, New Zealand's domestic consumption data has exceeded expectations, and the RBNZ continues to maintain a stable policy outlook — a medium-term bullish sign for NZD.
Market sentiment is leaning cautiously against the USD, especially as the Fed holds its “no cut but no hike” stance — boosting interest in alternative currencies.
📊 TECHNICAL OUTLOOK (H1):
NZD/USD is trading within an ascending price channel.
EMA 13 is above EMA 34 and EMA 200 — a positive short-term trend signal.
Two important zones to watch today are 0.5910 (key support) and 0.5961 (key resistance).
🎯 TRADE SETUPS FOR TODAY:
✅ SCENARIO A – BUY THE RETEST:
If price tests the 0.5910 zone and shows strong reaction:
BUY ZONE: 0.5910 – 0.5915
SL: 0.5890
TP: 0.5960 → 0.5980 → 0.6000 → 0.6006
→ This zone aligns with ascending channel support + prior FVG → strong rebound probability.
✅ SCENARIO B – BREAKOUT & CONTINUATION:
If price breaks and holds above 0.5961:
BUY SCALP: 0.5965 – 0.5970
SL: 0.5950
TP: 0.5980 → 0.6000 → 0.6006
❌ SCENARIO C – BEARISH BREAKDOWN:
If price fails to hold above 0.5910 and closes H1 candle below it:
SELL SCALP: 0.5900 – 0.5895
SL: 0.5915
TP: 0.5870 → 0.5850 → 0.5820
📌 FINAL THOUGHTS:
NZD/USD is at a critical decision point — this could be a retest before continuation to 0.6000 or the beginning of a deeper drop.
Watch the 0.5910 level closely to determine market direction.
⚠️ Risk management is key — high volatility expected as U.S. PMI data is set for release during today’s NY session.
🧠 Be patient. Let price come to your zone. React, don’t predict.

XAUUSD Market structure analysis Apparently I am technically bearish on gold on my daily timeframe, with a point of interest waiting to see how price reacts around that area. If price respects that point on interest, I will look for market shifts in lower timeframes and go short

EUR/USD Dual BUY LIMIT Strategy – Intraday + Swing Setup💬 Description:
This idea is based on a bullish structure confirmed across multiple timeframes (5m, 15m, 30m, 1H, 4H, Daily). The market shows strong buying pressure supported by clear technical signals:
🧠 Technical Justification:
Ichimoku Cloud: Price is clearly trading above the Kumo in all major timeframes, with bullish Tenkan/Kijun crossovers and strong Chikou Span alignment.
VWAP: Price remains consistently above VWAP, confirming intraday bullish control.
Moving Averages: All MAs (MA5 to MA200) are aligned in a bullish direction across 1H to Daily charts.
Momentum Indicators:
RSI remains between 58–69: bullish but not yet overbought.
MACD positive across all major TFs.
CCI above 100 on 1H and H4: indicates strong price momentum.
Pivot Points: Price action is holding above daily pivot and testing resistance zones (R1-R2), showing strength without overextension.
Conclusion:
This setup reflects a technically healthy bullish trend with multiple layers of confluence. There’s a strong probability of continuation to upper resistance levels, especially if price maintains structure above the VWAP and Ichimoku cloud. Perfect scenario for both intraday and short swing setups with favorable risk/reward potential.

GOLD 21/05 – FED'S HAWKISH STANCE VS. TECHNICAL LEVELSGOLD MARKET UPDATE 21/05 – FED'S HAWKISH STANCE VS. TECHNICAL LEVELS – BIG MOVE AHEAD?
Gold’s recent rally has paused as traders weigh the latest signals from the Federal Reserve. Despite geopolitical tensions and softer U.S. economic data, the Fed is sticking with a "higher-for-longer" interest rate policy, which has kept the U.S. dollar strong and put pressure on gold’s price action.
📉 However, the technical outlook suggests a different story.
⚙️ TECHNICAL ANALYSIS: Is It A Bearish Trap Or A Hidden Bullish Opportunity?
Looking at the 1H timeframe, XAU/USD is consolidating after reaching a major Fair Value Gap (FVG) between 3328–3356. This zone reveals significant volatility and potential liquidity grabs, with two key FVG zones forming above and below the current price levels.
There’s a potential bullish scenario if gold retraces to the 3250–3252 support zone, where strong trendline confluence and dynamic support are likely to drive demand.
On the flip side, any rejection from the 3354–3356 SELL ZONE could initiate a bearish trend, pushing gold lower to test key structural support levels.
💹 TRADING STRATEGY FOR TODAY:
🔵 BUY ZONE
Entry: 3252–3250
Stop Loss: 3246
Take Profit:
3256 – 3260 – 3264 – 3268 – 3272 – 3280 – 3300 – ???
🔵 BUY SCALP
Entry: 3277–3275
Stop Loss: 3272
Take Profit:
3280 – 3284 – 3288 – 3292 – 3296 – 3300
🔻 SELL ZONE
Entry: 3354–3356
Stop Loss: 3360
Take Profit:
3350 – 3346 – 3342 – 3338 – 3334 – 3330 – 3320
🔻 SELL SCALP
Entry: 3328–3330
Stop Loss: 3334
Take Profit:
3324 – 3320 – 3316 – 3310 – 3305 – 3300
🌍 MACRO INSIGHT
The Fed’s hawkish stance continues to weigh on gold, but geopolitical uncertainty and ongoing de-dollarization trends maintain gold’s appeal.
China, along with other central banks, is still actively accumulating gold, signaling that long-term bullish pressure remains intact.
Keep an eye on U.S. data this week, especially PMI and jobless claims, as these could act as short-term catalysts for gold.
📌 KEY NOTES
Volatility is increasing, so stay disciplined. Stick to your key levels and manage risk effectively. Patience and strategy will be key as the market moves in the coming days.
Stay alert and trade wisely!
