EURUSD Set To Grow! BUY!
My dear subscribers,
My technical analysis for EURUSD is below:
The price is coiling around a solid key level - 1.1165
Bias - Bullish
Technical Indicators: Pivot Points Low anticipates a potential price reversal.
Super trend shows a clear buy, giving a perfect indicators' convergence.
Goal - 1.1185
About Used Indicators:
By the very nature of the supertrend indicator, it offers firm support and resistance levels for traders to enter and exit trades. Additionally, it also provides signals for setting stop losses
Disclosure: I am part of Trade Nation's Influencer program and receive a monthly fee for using their TradingView charts in my analysis.
———————————
WISH YOU ALL LUCK
LONG

AUDUSD Is Very Bullish! Buy!
Take a look at our analysis for AUDUSD.
Time Frame: 30m
Current Trend: Bullish
Sentiment: Oversold (based on 7-period RSI)
Forecast: Bullish
The market is on a crucial zone of demand 0.640.
The oversold market condition in a combination with key structure gives us a relatively strong bullish signal with goal 0.641 level.
P.S
We determine oversold/overbought condition with RSI indicator.
When it drops below 30 - the market is considered to be oversold.
When it bounces above 70 - the market is considered to be overbought.
Disclosure: I am part of Trade Nation's Influencer program and receive a monthly fee for using their TradingView charts in my analysis.
Like and subscribe and comment my ideas if you enjoy them!

HelenP. I Bitcoin will fall to support zone and then start riseHi folks today I'm prepared for you Bitcoin analytics. This chart shows how the price continues to trade inside a rising channel, with the price currently hovering just above the support zone around 101000. After forming a clean consolidation phase near the upper boundary of the structure, the market is showing signs of a potential pullback toward this zone. However, the broader trend remains bullish, and as long as price holds within the ascending formation, this correction may act as a base for the next move higher. The consolidation structure formed at the top indicates that buyers are not rushing in aggressively, but they are also not allowing prices to drop sharply, a classic sign of accumulation. This aligns well with the previously confirmed trend line and horizontal support zone. If BTC holds this area and finds renewed momentum, I expect a breakout from the consolidation range to the upside. My goal remains at 107000 points, which sits a little higher than the projected top of the current channel. Given the strength of the structure, the higher lows, and the recent defense of support, I maintain a bullish bias and anticipate another upward wave from this level. If you like my analytics you may support me with your like/comment ❤️

ETHUSD Is Bullish! Long!
Here is our detailed technical review for ETHUSD.
Time Frame: 9h
Current Trend: Bullish
Sentiment: Oversold (based on 7-period RSI)
Forecast: Bullish
The market is approaching a significant support area 2,593.04.
The underlined horizontal cluster clearly indicates a highly probable bullish movement with target 2,920.18 level.
P.S
The term oversold refers to a condition where an asset has traded lower in price and has the potential for a price bounce.
Overbought refers to market scenarios where the instrument is traded considerably higher than its fair value. Overvaluation is caused by market sentiments when there is positive news.
Disclosure: I am part of Trade Nation's Influencer program and receive a monthly fee for using their TradingView charts in my analysis.
Like and subscribe and comment my ideas if you enjoy them!

BTC Bullish Deep CrabAn idea to display an potential Deep Crab idea. This might hit the support line at 98k that was the last resistance from the last rally. Whether this holds is another story. Thank you

NATGAS: Long Trade Explained
NATGAS
- Classic bullish pattern
- Our team expects retracement
SUGGESTED TRADE:
Swing Trade
Buy NATGAS
Entry - 3.325
Stop - 3.206
Take - 3.559
Our Risk - 1%
Start protection of your profits from lower levels
Disclosure: I am part of Trade Nation's Influencer program and receive a monthly fee for using their TradingView charts in my analysis.
❤️ Please, support our work with like & comment! ❤️

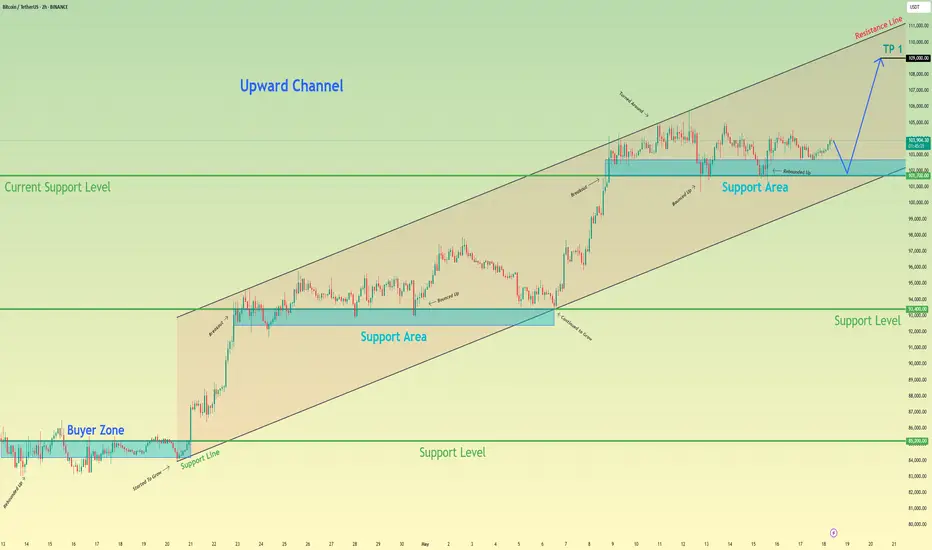
Bitcoin can continue grow in channel, after small correctionHello traders, I want share with you my opinion about Bitcoin. In this chart, we can see how the price remains inside a clear upward channel, respecting both support and resistance boundaries. After breaking above the 93400 - 92400 support area, the price continued to grow and formed a new support zone between 101700 - 102700 points. This area has been tested several times, showing strong buyer interest and keeping the bullish structure intact. Right now, BTC is hovering just above this support area. A minor correction down to this zone would be healthy and could provide fuel for the next upward leg. The market structure shows higher highs and higher lows, typical of a stable channel-driven trend. As long as the price stays above 101700 points, I expect it to move toward the upper channel boundary. That’s why my current target is set at 109000 points, which is the next key resistance and the top of the channel. This move would align with the current trend and follow the previous impulse-retracement pattern we’ve seen throughout this structure. Please share this idea with your friends and click Boost 🚀
Gold can correct to support line of channel and then start growHello traders, I want share with you my opinion about Gold. In this chart, we can see how the price, after forming a triangle structure and breaking out to the upside, Gold entered a downward channel, where it has been consistently respecting both the resistance and support lines. Each bounce from the lower boundary of this channel signals local buyer interest, especially near the support level around 3060, which also overlaps with the buyer zone. Recently, the price rebounded from this support line, indicating a potential start of a bullish correction inside the channel. This move is consistent with past price behavior, strong impulses from the bottom boundary followed by gradual movement toward the upper resistance line. Given the structure and the ongoing bounce, I expect Gold can correct the support line of the channel, after which it turns around and starts to grow to the 3290 resistance level, which aligns with the upper boundary of the pattern and the beginning of the seller zone. That’s why my TP 1 is set at 3290 points - a reasonable technical target within the current channel formation. Please share this idea with your friends and click Boost 🚀
Disclaimer: As part of ThinkMarkets’ Influencer Program, I am sponsored to share and publish their charts in my analysis.

US30 Is Very Bullish! Buy!
Take a look at our analysis for US30.
Time Frame: 1D
Current Trend: Bullish
Sentiment: Oversold (based on 7-period RSI)
Forecast: Bullish
The market is on a crucial zone of demand 42,620.8.
The oversold market condition in a combination with key structure gives us a relatively strong bullish signal with goal 45,530.9 level.
P.S
Overbought describes a period of time where there has been a significant and consistent upward move in price over a period of time without much pullback.
Disclosure: I am part of Trade Nation's Influencer program and receive a monthly fee for using their TradingView charts in my analysis.
Like and subscribe and comment my ideas if you enjoy them!

BTC Bullish GartleyAn idea to display an potential Gartley idea. This might hit the trendline that is upsloping. Whether this holds is another story. Thank you
BTC to between 207k-315k come octoberThis is solely a prediction for the coming cycle top. I am looking for a third trend touch that will occur between 3.618 and 5.618 of the previous cycle high to swing low. If the time frame cycle to cycle lines up at 47 monthly bars, cycle top will occur in third quarter, likely in october.
Summer time may be slow, but I think buying pressure will ramp up in the fall. This will lead to the eventual blowoff top that btc goes through each cycle.
Blow off target = 207k-315k
This is not financial advice, this is just a prediction I would like to publish to look back on.
Let me know what you think is going to happen by years end in the comments!

SILVER: Long Trade with Entry/SL/TP
SILVER
- Classic bullish setup
- Our team expects bullish continuation
SUGGESTED TRADE:
Swing Trade
Long SILVER
Entry Point - 32.284
Stop Loss - 32.071
Take Profit - 32.675
Our Risk - 1%
Start protection of your profits from lower levels
Disclosure: I am part of Trade Nation's Influencer program and receive a monthly fee for using their TradingView charts in my analysis.
❤️ Please, support our work with like & comment! ❤️

EURCHF Is Going Up! Long!
Please, check our technical outlook for EURCHF.
Time Frame: 15m
Current Trend: Bullish
Sentiment: Oversold (based on 7-period RSI)
Forecast: Bullish
The price is testing a key support 0.934.
Current market trend & oversold RSI makes me think that buyers will push the price. I will anticipate a bullish movement at least to 0.936 level.
P.S
Overbought describes a period of time where there has been a significant and consistent upward move in price over a period of time without much pullback.
Disclosure: I am part of Trade Nation's Influencer program and receive a monthly fee for using their TradingView charts in my analysis.
Like and subscribe and comment my ideas if you enjoy them!

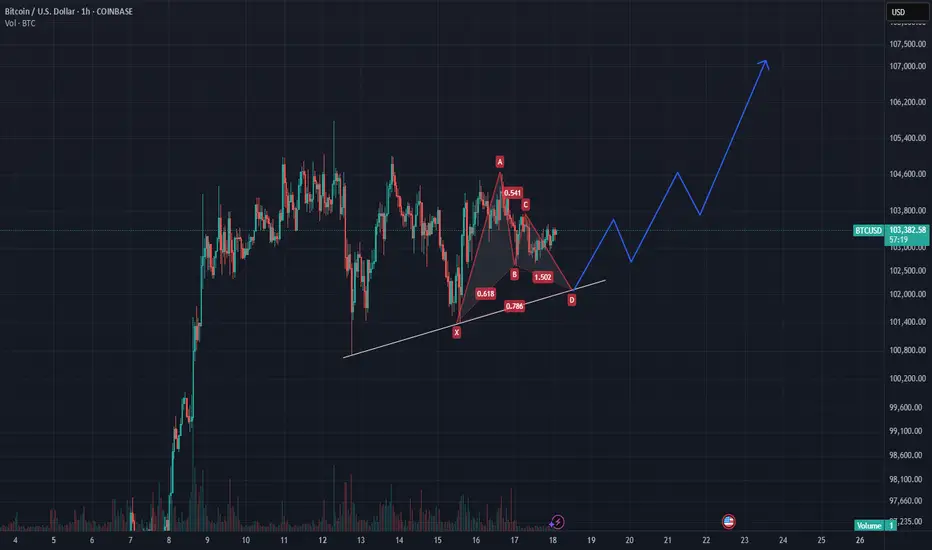
BITCOIN - Price can leave pennant and rise to $106500 pointsHi guys, this is my overview for BTCUSDT, feel free to check it and write your feedback in comments👊
Some time ago, price traded inside a flat, where it declined to the $93400 support level and then rose to the top part of the flat.
Then it corrected, after which made a strong upward impulse, exiting from flat, and continued to grow in pennant.
In pennant, BTC broke $97800 and $102300 levels, after which it made retest and continued to grow to resistance line.
When the price reached this line, it corrected to support area, after which tried to grow, but failed and fell back.
But recently it rose to the resistance line of the pennant, where at the moment it continued to trades near.
In my opinion, BTC can correct to support line and then bounce up to $106500, exiting from the pennant.
If this post is useful to you, you can support me with like/boost and advice in comments❤️

GBP/NZD BULLISH BIAS RIGHT NOW| LONG
Hello, Friends!
Previous week’s red candle means that for us the GBP/NZD pair is in the downtrend. And the current movement leg was also down but the support line will be hit soon and lower BB band proximity will signal an oversold condition so we will go for a counter-trend long trade with the target being at 2.259.
Disclosure: I am part of Trade Nation's Influencer program and receive a monthly fee for using their TradingView charts in my analysis.
✅LIKE AND COMMENT MY IDEAS✅

EURNZD What Next? BUY!
My dear followers,
This is my opinion on the EURNZD next move:
The asset is approaching an important pivot point 1.8840
Bias - Bullish
Technical Indicators: Supper Trend generates a clear long signal while Pivot Point HL is currently determining the overall Bullish trend of the market.
Goal - 1.8961
About Used Indicators:
For more efficient signals, super-trend is used in combination with other indicators like Pivot Points.
Disclosure: I am part of Trade Nation's Influencer program and receive a monthly fee for using their TradingView charts in my analysis.
———————————
WISH YOU ALL LUCK

EURUSD: Long Signal with Entry/SL/TP
EURUSD
- Classic bullish formation
- Our team expects growth
SUGGESTED TRADE:
Swing Trade
Buy EURUSD
Entry Level - 1.1202
Sl - 1.1128
Tp - 1.1344
Our Risk - 1%
Start protection of your profits from lower levels
Disclosure: I am part of Trade Nation's Influencer program and receive a monthly fee for using their TradingView charts in my analysis.
❤️ Please, support our work with like & comment! ❤️

EURJPY: Will Keep Growing! Here is Why:
The analysis of the EURJPY chart clearly shows us that the pair is finally about to go up due to the rising pressure from the buyers.
Disclosure: I am part of Trade Nation's Influencer program and receive a monthly fee for using their TradingView charts in my analysis.
❤️ Please, support our work with like & comment! ❤️

EURUSD: Expecting Bullish Continuation! Here is Why:
Looking at the chart of EURUSD right now we are seeing some interesting price action on the lower timeframes. Thus a local move up seems to be quite likely.
Disclosure: I am part of Trade Nation's Influencer program and receive a monthly fee for using their TradingView charts in my analysis.
❤️ Please, support our work with like & comment! ❤️

EURO - Price can make small correction and then bounce upHi guys, this is my overview for EURO, feel free to check it and write your feedback in comments👊
Recently, price entered to falling channel, where it at once fell to $1.1330 level and then not long time traded near this level.
Next, price rose to resistance line of channel, and some time traded near, after which dropped.
Price broke $1.1330 level and started to traded below this level, and later it continued to decline in channel.
Later, Euro made a gap and then exited from channel, after which turned around and started to grow in a rising channel.
In this channel, price broke $1.1140 level and continued to move up until it reached resistance line.
Then price corrected, and now I expect that Euro can bounce up from support area to $1.1280 inside channel.
If this post is useful to you, you can support me with like/boost and advice in comments❤️
Disclaimer: As part of ThinkMarkets’ Influencer Program, I am sponsored to share and publish their charts in my analysis.

HelenP. I Gold can break resistance level and continue move upHi folks today I'm prepared for you Gold analytics. At the moment, price is forming a tightening triangle structure, and the market appears to be respecting both the horizontal support levels and the rising trend line that frames the lower boundary of this pattern. After bouncing strongly from the support zone around 2970 - 2940 points, the price rebounded right off the trend line, confirming it once again as a key structural level. Recently, XAU approached the resistance zone between 3205 and 3230, which has acted as a cap for the price several times before. But this time, the move into resistance comes from a place of strength. Momentum is building steadily after each pullback, and buyers have consistently stepped in near the ascending support. Given the context sustained higher lows, compression within a triangle, and a base forming just under resistance, there’s a strong chance the price could push through the 3205 level on a renewed attempt. A clean breakout above this resistance, followed by a retest, would offer strong confirmation that bulls are ready to extend the move. That’s why I’ve set my current goal at 3320 points, which almost aligns with the upper range of the triangle projection. If you like my analytics you may support me with your like/comment ❤️
Disclaimer: As part of ThinkMarkets’ Influencer Program, I am sponsored to share and publish their charts in my analysis.

EURUSD Is Going Up! Long!
Please, check our technical outlook for EURUSD.
Time Frame: 1h
Current Trend: Bullish
Sentiment: Oversold (based on 7-period RSI)
Forecast: Bullish
The price is testing a key support 1.116.
Current market trend & oversold RSI makes me think that buyers will push the price. I will anticipate a bullish movement at least to 1.118 level.
P.S
Please, note that an oversold/overbought condition can last for a long time, and therefore being oversold/overbought doesn't mean a price rally will come soon, or at all.
Disclosure: I am part of Trade Nation's Influencer program and receive a monthly fee for using their TradingView charts in my analysis.
Like and subscribe and comment my ideas if you enjoy them!

CADJPY bullishThis is a swing bullish deal.
Trouble bottom pattern and on a daily it Bullish Bat/Crab pattern.
You can enter from the current price and stop loss 103.75 and target 110.413

eth buy midterm"🌟 Welcome to Golden Candle! 🌟
We're a team of 📈 passionate traders 📉 who love sharing our 🔍 technical analysis insights 🔎 with the TradingView community. 🌎
Our goal is to provide 💡 valuable perspectives 💡 on market trends and patterns, but 🚫 please note that our analyses are not intended as buy or sell recommendations. 🚫
Instead, they reflect our own 💭 personal attitudes and thoughts. 💭
Follow along and 📚 learn 📚 from our analyses! 📊💡"
