ETHFI entry targetsDaily TF
Using the fibbonachi rectracement tool the 0.5 is currently sat @ $0.81.
If we see a move down this could present a long opportunity with top line being $4.50. Breakout of historical downtrend could propel price to this level.
Reward vs Risk @ 29:1
Trend Lines

Bitwise Bitcoin ETF | BITB | Long at $46.25It definitely should get everyone's attention when a US Senator (David McCormick) is willing to dish out up to $600,000 in a Bitcoin ETF ( AMEX:BITB ):
Feb. 27: Bought $50,000 to $100,000
Feb. 28: Bought $15,000 to $50,000
March 3: Bought $50,000 to $100,000
March 5: Bought $15,000 to $50,000
March 10: Bought $50,000 to $100,000
March 11: Bought $15,000 to $50,000
March 13: Bought $15,000 to $50,000
March 20: Bought $50,000 to $100,000
Something may be brewing this year with the "U.S. crypto reserve" and I'll throw down a couple grand at $46.25 with a self-proclaimed wild prediction into 2026: Bitcoin to $120,000.
Bitwise ETF Targets:
$50.00
$55.00
$60.00
$65.00

Perfectly hold the pullback and continue to buy.Gold opened at around 3240 and then rushed to 3252 and then retreated. In the evening, we also gave a short position near the rebound to 3240. After all, there is a lot of pressure from above, and the technical side also needs to repair the strategy, so we gave a short position entry near 3237-38, and the target is 3215. As of the retracement, it reached the lowest point near 3206, which also successfully reached our target position. Today's Asian session high and retreat is completely a technical adjustment. It bottomed out and rebounded yesterday, with an increase of more than one hundred US dollars. The technical bulls are weak and need to pull back. This is why I gave the short position. Be a steady trader.
The gold market showed a V-shaped reversal pattern of bottoming out and rebounding yesterday. The daily line closed with a hammer-shaped positive line with an extremely long lower shadow, indicating that the support below is strong, but the overall high-level oscillation pattern is still maintained. Technical indicators show that short-term correction pressure still exists: the stochastic indicator is blunted at a high level, the MACD double-line dead cross is downward, and the Bollinger band opens downward. The gold price is likely to fluctuate around the middle and lower tracks.
The 4-hour level oscillates to the short side, and the 3200 line becomes the watershed between long and short. If it effectively falls below this level, the shorts will regain the initiative; on the contrary, the longs need to break through the strong resistance area of 3265-3270 to reverse the decline. At the close of the weekly line, the market has a demand for a restorative decline. If it falls below the 3200 integer mark, the target below will look at the 3180-3170 area. Focus on the effectiveness of the 3265-3270 resistance and the strength of the 3200 support, and be alert to the violent fluctuations in the closing market on Friday.
Gold recommendation: Go long when it falls back to around 3215-3205. Target 3230-40-50 first line

Is about to do somethingPrice just tested the support zone and is bouncing off. This is not a dead cat bounce, is going for more. TP 1 at 4.5, TP 2 at 6. SL triggers if a daily candle closes as shown. But it has to close. This stock is highly volatile, be careful.

GBP/USD: Bull Flag Watch as Momentum Builds for Topside BreakGBP/USD traders should be on alert for a potential topside break, with price action resembling a bull flag formation.
Downtrend resistance comes in near 1.3340 today—a key level to watch for those considering bullish setups.
A break above that trendline would shift focus to the April 29 high at 1.3444. If cleared, there's not much standing in the way until 1.3644.
Momentum signals are also starting to turn more constructive, with the 14-day RSI breaking its recent downtrend and MACD curling back towards the signal line above zero. Taken together, the setup favours buying dips and trading in line with any upside break.
Good luck!
DS

HelenP. I Euro may reach resistance level and break itHi folks today I'm prepared for you Euro analytics. Observing this chart, we can see how the price appears to be finding stability just above the trend line support. This zone also aligns closely with the local swing low formed after the rejection from the resistance area near 1.1270. Buyers managed to defend this key trend structure, forming a potential higher low setup within the broader bullish framework. The price is now trading below a significant resistance cluster, where both horizontal and supply pressure meet, the 1.1270 to 1.1315 zone. However, the fact that EUR is respecting the rising trend line and hasn't broken below the previous local low suggests that bullish momentum may still be intact. A corrective dip into the trend line could offer the final shakeout before a new leg upward begins. If price manages to build strength around this support and push back toward the resistance zone, a breakout becomes increasingly likely. In such a case, the market may extend toward the 1.1400 area, which I consider my current target. Given the sustained higher lows, trend support, and structure of accumulation forming below resistance, I expect EURUSD to continue pushing upward after this retest phase. If you like my analytics you may support me with your like/comment ❤️
Disclaimer: As part of ThinkMarkets’ Influencer Program, I am sponsored to share and publish their charts in my analysis.

XLMUSDT Potential UpsidesHey Traders, in today's trading session we are monitoring XLM/USDT for a buying opportunity around 0.2730 zone, XLM/USDT is trading in an uptrend and currently is in a correction phase in which it is approaching the trend at 0.2730 support and resistance area.
Trade safe, Joe.

Bitcoin Potential UpsidesHey Traders, in today's trading session we are monitoring BTCUSDT for a buying opportunity around 100,000 zone, Bitcoin is trading in an uptrend and currently is in a correction phase in which it is approaching the trend at 100,000 support and resistance area.
Trade safe, Joe.

What’s the Next Move for GBP/AUD?
The GBP/AUD pair is trading in an uptrend, forming higher highs and higher lows, and the current pullback is considered a corrective move within this upward trend.
The level of 2.05763 is seen as a positive support level for the pair, where a potential rebound to the upside could occur, targeting the 2.07442 level.
However, if the price falls below the 2.05110 level and closes a 4-hour candle beneath it, the bullish scenario would be invalidated, and the trend would shift from bullish to bearish.
Note:
Traders should monitor economic news and data related to the Australian dollar and the British pound, as their outcomes can significantly impact the movement of this currency pair.

Lower Parallel Channel/Trendline tested again, 3rd time a charm?NOTE : I am not an expert trader by any means, I am open input and sharing my ideas. I am still learning this is my second time.
*************************************
DAILY
Price is consolidating or ranging
*************************************
4 HOUR
- Price seen between support and resistance
(DOWN/BEAR)
- Parrallel channel seen:
---- its height is around 5000 pips. a little more. (that i was able to measure)
---- with this being the 3rd test to its bottom line,, still hoovering in the lower channel, which could be bearish. however, it is looking like a rejection (as it is loosing momentum, and a doji is forming and likely to close as so.
---- yet, the channel is sell/short pattern. so next few candles may come with the moment and still turn, to go down
*************************************
In contrast (UP/ BULLS)
- Ukraine is about to begin to use btc as its national assest and an answer for that is pending soon. ( price will go up b/c this is good for this pair)
- two fake-outs seen at support
- the channel could continue sideways and actually go up
- or the channel will soon be invalidated, moving up, breaking thru top channel line.
*************************************
Right now, most technical indications are neutral, a this time for this pair. So lets wait and see.
*************************************
Happy trading.
Open to comments and advice.
*************************************

Long orders are trapped,what should we do with the US gold marke🗞News side:
1. India considers using new Indus River project to cut water supply to Pakistan.
2. Pay attention to the news of Russia-Ukraine ceasefire negotiations today
📈Technical aspects:
Gold once fell to around 3170, which is in line with our judgment of bullish weakness. This is why we are not in a hurry to participate in long orders today. I know that many bros also listened to the outside world and went long around 3200, which led to being trapped. At present, the gold price is constantly testing the 3170 support line. If it falls below, it will look to the 3150 support line. If it does not break, it will be treated as a shock. On the top, temporarily pay attention to the 3205-3215 line of resistance. If it encounters resistance and pressure, go short. On the bottom, first pay attention to the 3170 support line, and then pay attention to the 3150-3140 support line. Hold if it breaks.
If you agree with this view, or have a better idea, please leave a message in the comment area. I look forward to hearing different voices.
OANDA:XAUUSD FX:XAUUSD TVC:GOLD FXOPEN:XAUUSD FOREXCOM:XAUUSD

ETH 2nd rally to 2900 then 3000
Trend: Strong bullish momentum with price trading above key EMAs 10 20 50
Momentum: High RSI suggests strong buying pressure still above the red support line but also warns of potential overbought conditions could snap back would be worried unless we go below the 50 EMA.
Volume: volume is picking up again
MACD: temporary fear is fading out, greed is about to kicking again
Target 1 2800
Target 2 2900
Target 3 3000
Other bullish factor
A lot of positive headlines, government adoption , BTC is bullish. Good set up over all simple yet effective
Great risk reward opportunity !

Skeptic | Solana’s Uptrend Ignites: Big Moves Ahead?Hey everyone, Skeptic here! Let’s kick off this Friday morning with a deep dive into Solana , one of my favorite coins! 😊 In this analysis, I’m breaking down the charts, spotting spot and futures triggers, and exploring what’s next for SOL. Stick with me to the end, and we’ll grow together! <3 Let’s start with the Daily Timeframe. 📊
Daily Timeframe: The Big Picture
We’re riding a solid upward channel on Solana’s daily chart. The price has reacted beautifully to the ceiling, floor, and especially the midline, which gives this channel a ton of credibility—we can trust it. After a strong price surge starting October 20 and running through January 25 , we entered a price correction. I expected a pullback to 80.78 , but we corrected to 95.15 instead. Now, we’ve formed a head and shoulders pattern, and the neckline has broken, activating the pattern. This pattern, at the end of a correction, signals a trend reversal and a continuation of the major uptrend. The target for this pattern is the height from the head to the neckline, which takes us to 202.82 —coincidentally, a key resistance level ahead. I expect we might range around that level or, if we break it, it’ll likely be a sharp and messy move. So, plan ahead to avoid FOMO or making rash moves. Our spot entry was at 151.78 , but a break above 202.82 could be another solid trigger, with a stop loss below the support at 147.97 . Don’t FOMO —wait for confirmations from SOL/BTC and Bitcoin’s action. Volume is your friend for spotting momentum, so keep a close eye on it. Let’s zoom into the 4-Hour Timeframe for long and short triggers.
4-Hour Timeframe: Long & Short Setups
After breaking the 153.29 resistance, we saw a nice rally, but then we hit some turbulence. If you look closely, the market seems to have formed a symmetrical triangle—the worst pattern for breakout and momentum-based strategies. Why? The market doesn’t care about support or resistance here, making it tough to tell if moves are fake or real. So, what’s the plan?
Let’s drop to the 1-Hour Timeframe.
The last level we got rejected from was 174.51 . If we revisit this level with rising volume and candles showing buyer strength—think good lower shadows and strong green bodies with high closes—it means sellers pushed the price down, but buyers stepped in and drove it back up. If you see this setup and we break the 174.51 resistance, you can open a long position. For shorts, since the major and secondary trends are uptrends, I’m not giving any short triggers—it’s completely against the trend, and the risk of hitting a stop loss is way too high. Be patient. Wait for this uptrend to fake out and drop below 149.07 —then we’ll hunt for shorts. 🙂 Let’s also take a quick look at SOL/BTC.
SOL/BTC Analysis
On the daily timeframe, we’ve got a clean head and shoulders pattern for SOL/BTC, with the neckline broken and a pullback to it now. This could lead to a strong rally moving forward, provided it’s not a fakeout and we don’t fall back below the support at 0.0015043. What does this mean? If the market stays in an uptrend, Solana could outperform Bitcoin. And if BTC.D is dropping during a market rally, Solana could see some serious growth. That’s the Solana breakdown! If you’ve got your own technical or fundamental analysis on this coin, I’d love to hear it—drop it in the comments so we can grow together! 😄
💬 Let’s Talk!
If this analysis helped you out, give it a quick boost —it means a lot! 😊 Got a pair or setup you want me to tackle next? Drop it in the comments, and I’ll get to it. Thanks for hanging out, and I’ll see you in the next one. Keep trading smart! ✌️

BTC/USD what a ..!BTC/USD preparing for blast off! first stop will likely be a quick one (111-114k) followed by (124-128k). If instead BTC decides to retest lower before continuing higher. Breaking below 99.5 would likely spell a drop to (97.5k/95.3k/92.5k/89k) Breaking and holding above 103.8k will confirm the continued uptrend and also fully confirm the cup and handle break out! #NFA GOOD LUCK! and GOD SPEED!

Ethereum Trap Play Complete – Time to Pump!Trap + deviation strategy in play!
Price faked out below structure, collected liquidity, and reclaimed trendline.
Expecting ETH to continue bullish inside the rising channel.
Target: $2738 | SL: Below $2500

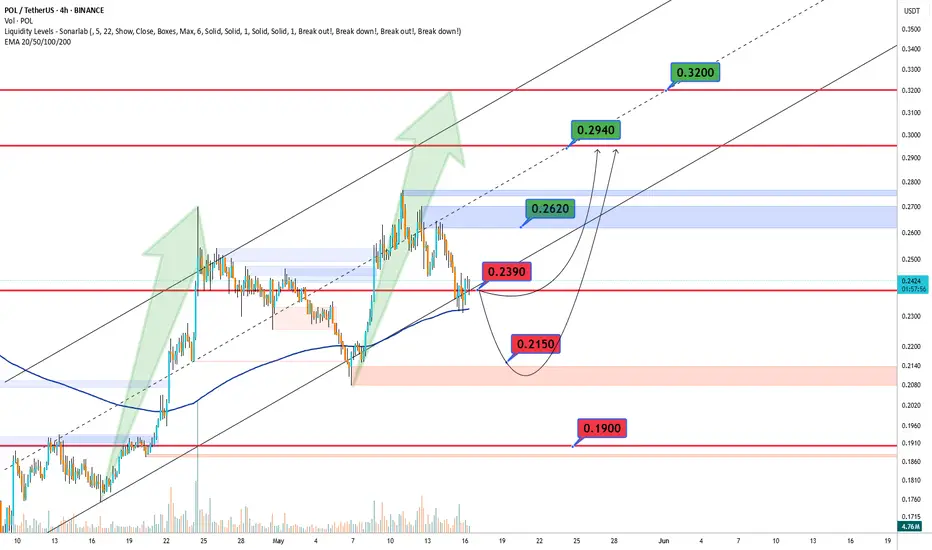
POLUSDT Bullish🔍 BINANCE:POLUSDT Technical Outlook – May 16 🔍
Bulls are watching the key $0.2390 level! 🔼
If broken, we could see a rally towards $0.2620, then $0.2940, and even $0.3200 if momentum stays strong 🚀
But if price gets rejected... 👀
Watch support at $0.2150 – and if that fails, $0.1900 could be next 🛑
📊 Current zones to watch:
🔴 Resistance: $0.2620 | $0.2940 | $0.3200
🟢 Support: $0.2390 | $0.2150 | $0.1900
EURCAD: Another Bearish Pattern 🇪🇺🇨🇦
Earlier, we spotted a head & shoulder pattern on EURCAD on a daily
and a confirmed breakout of its neckline.
Analysing a price action, I spotted another bearish formation today.
The price formed a bearish flag pattern, and it is retesting a broken
trend line at the moment.
I think that the pair may drop lower soon.
Next support - 1.5503
❤️Please, support my work with like, thank you!❤️
I am part of Trade Nation's Influencer program and receive a monthly fee for using their TradingView charts in my analysis.

Is it doing?! ...---...I had told last night that the Gold is strongly about to be some back for a correction;Now it did and I assume(as I said in 1 hour) it needs a little correction to top and maybe continues fall after that

Gold Bullish Outlook - Gold BullishFollowing strong buying momentum observed yesterday, gold is currently consolidating within a falling wedge pattern — a typically bullish setup. A breakout from this pattern could trigger a fresh upward move in the price of gold.
Post-Breakout Bullish Targets:
Target 1: 3230
Target 2: 3240
Target 3: 3250
Target 4: 3275
Disclaimer: This is a technical analysis-based outlook. Please assess your risk-to-reward ratio and follow your individual trading strategy. This is not financial advice — trade responsibly and according to your plan.


BITCOIN MIGHT SEE $160KWe have a vey similar movement for bitcoin compare to few months ago
1) Pass the 20MA on weekly
2) Bullish cross on MACD
3) Cross and stay above the weekly resistance ( yellow trendline )
4) +60% upside movement
Im not saying 60% raise is coming to bitcoin ( may be come ), but at least $134k - $140k is very likely IMO

XAUUSD remains bearish unless it breaks 3265🗞News side:
1. India considers using new Indus River project to cut water supply to Pakistan.
2. Pay attention to the news of Russia-Ukraine ceasefire negotiations today
📈Technical aspects:
Today's opening correction is due to technical repair and adjustment, which is why I shorted. The support of 3200-3210 is of great significance to the short-term trend. If it can be supported here again, it may further promote the upward expansion space. However, after the rebound in the morning Asian session, it did not break through the 3265 line. On the contrary, the bulls began to weaken. Today is Friday, and the market is not expected to show a unilateral strong attitude. It will be treated as a shock during the day. Before breaking through 3265 above, we can short at a small level during the intraday rebound. Short-term operation suggestions, temporarily look at 3235-3240 on the upper side, and look at the support of 3210-3200 on the lower side.
If you agree with this view, or have a better idea, please leave a message in the comment area. I look forward to hearing different voices.
FOREXCOM:XAUUSD FXOPEN:XAUUSD TVC:GOLD FX:XAUUSD OANDA:XAUUSD


Gold has a strong deep V, 3200 support is good for longThe 1-hour moving average of gold begins to turn and continue, so the momentum of gold bears begins to weaken, and gold bulls may begin to exert their strength. However, gold started to rise all the way from 3120 to 3252 yesterday. Gold rose by about 130 points, so the volatility began to increase. Therefore, we must wait patiently for gold to adjust. Because of such a large fluctuation, an adjustment will also be tens of dollars. We must wait patiently for the adjustment and stabilize before going long. After gold breaks through 3192, it is considered a strong deep V breakthrough of important resistance. Then 3192 of gold has now become an important support level. If it falls back to 3192 in the Asian session, go long on dips. If gold falls back to near the 3200 mark, you can try to go long.
Since gold has started to reverse strongly, gold bulls have begun to show their muscles. In the short term, we should not be stubbornly bearish anymore. We should be flexible and adapt to the market. The market is like this, changing rapidly. We should adapt to the market and not be too obsessed with bears or bulls. Obsession is a trap. Gold bulls are strong now, so gold is now the home of bulls. Go long when the Asian session falls back.
