INVITE-ONLY SCRIPT
ICC TREND CONDITIONS
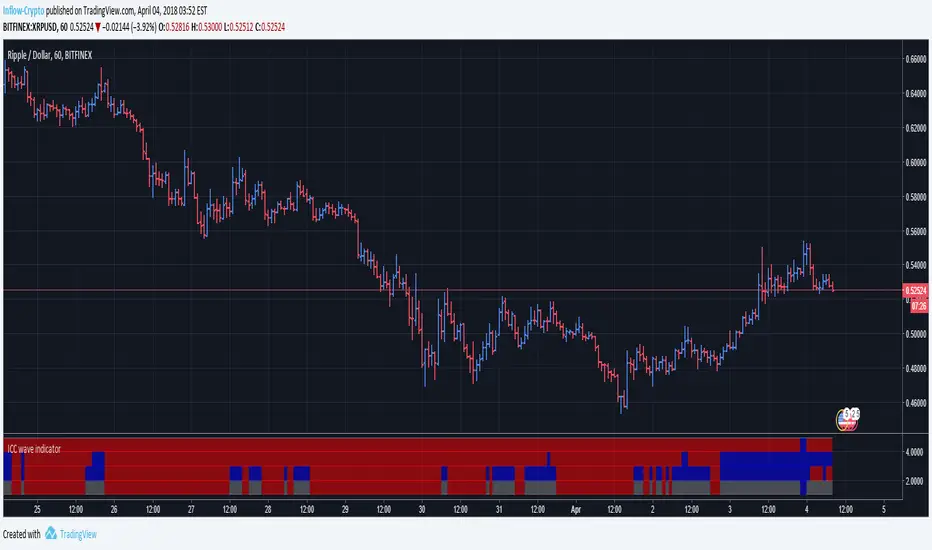
This indicator shows you when suitable trend conditions are in place for high probability trades in the direction of 1-hour down to 5-minute trend.
- Red color indicates bearish trend
- Blue color indicates bullish trend
- 1st row (starting on top) is 1h trend - indicates that price is above (blue) or below (red) 365 WMA on 1h timeframe.
- 2nd row (starting on top) is 15min trend - indicates that price is above (blue) or below (red) 365 WMA on 15min timeframe.
- 3rd row (starting on top) is 5min trend - indicates that price is above (blue) or below (red) 365 WMA on 5min timeframe.
- 4th row (starting on top) is a combination of rows 1-3. It shows when row 1-3 are in line for high probability long or short trades.
- When the 4th row is colored RED, it means that the conditions for sell (short) trades are in place.
- When the 4th row is colored BLUE, it means that the conditions for buy (long) trades are in place.
- When the 4th row is colored GRAY, it means that there is indecision between buyers and sellers, the market is in process of rolling over or consolidating. This means that there are no favorable conditions for ICC wave trading and you should stay out of the market until there is a clear direction.
Endast inbjudanskript.
Tillgången till detta skript är begränsat till användare som har godkänts av författaren och kräver vanligtvis betalning. Du kan lägga till det till dina favoriter men du kan bara använda det efter att ha begärt och fått författarens tillstånd. Contact TIHA01 for more information, or follow the author's instructions below.
TradingView does not suggest paying for a script and using it unless you 100% trust its author and understand how the script works. In many cases, you can find a good open-source alternative for free in our Community Scripts.
Vill du använda det här skriptet i ett diagram?
Warning: please read before requesting access.
Frånsägelse av ansvar
Informationen och publikationerna är inte avsedda att vara, och utgör inte heller finansiella, investerings-, handels- eller andra typer av råd eller rekommendationer som tillhandahålls eller stöds av TradingView. Läs mer i Användarvillkoren.