OPEN-SOURCE SCRIPT
ASR_Top/Bottom
Uppdaterad
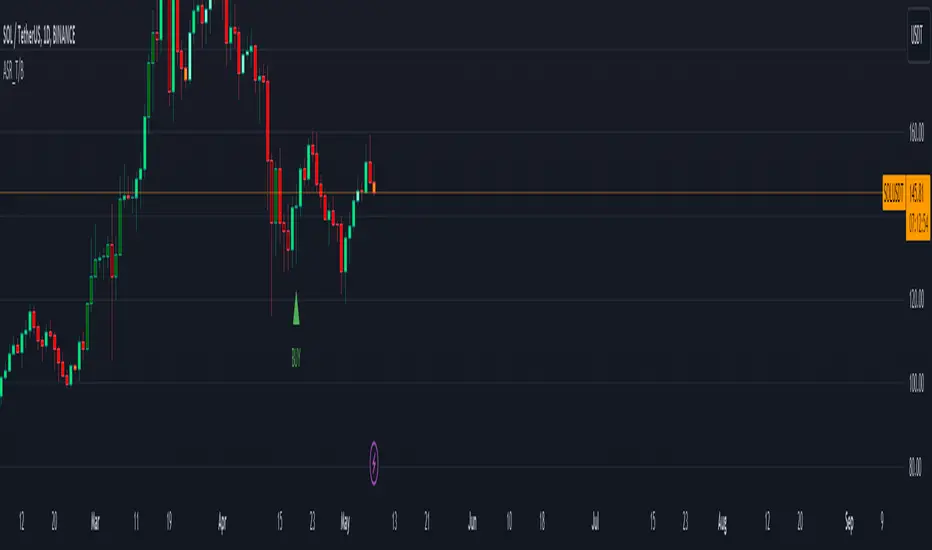
This is top and bottom finder indicator which is using RSI , Mavilimw(Kivanc's) , BB and WT
it is better use this indicator on Daily Weekly and 4H chart
There is 2 signal Buy and Sell , you can use different strategies such as ( when you see Buy signal you can buy 25% of your portfolio and when you see SELL signal sell 25% of portfolio )
rule is basic :
Buy - when RSI and WT is in overbought zone and Last bar touched upper BB line and backed inside it would triggered buy
SELL- when RSI and WT is in oversold zone and last bar touched lower band of BB and up inside it would be triggered sell
Strategies :
it is better use this indicator also with RSI divergence
let say you see BUY signal and after that you see rsi positive divergence it is confirmed that we are in bottom or when Sell signal happened and rsi negative divergence happened it confirms that we are in top
also you can use 200 ma , if you see sell in below 200 ma it is exit opportunity or if you see buy above 200 ma it is buy opportunity
I would appreciate your comments and opinions or experiences when you are using this indicator
Versionsinformation
cnaged logic of buy and sell Skript med en öppen källkod
In true TradingView spirit, the author of this script has published it open-source, so traders can understand and verify it. Cheers to the author! You may use it for free, but reuse of this code in publication is governed by House rules. Du kan ange den som favorit för att använda den i ett diagram.
Frånsägelse av ansvar
Informationen och publikationerna är inte avsedda att vara, och utgör inte heller finansiella, investerings-, handels- eller andra typer av råd eller rekommendationer som tillhandahålls eller stöds av TradingView. Läs mer i Användarvillkoren.