OPEN-SOURCE SCRIPT
Strength Measurement -HT
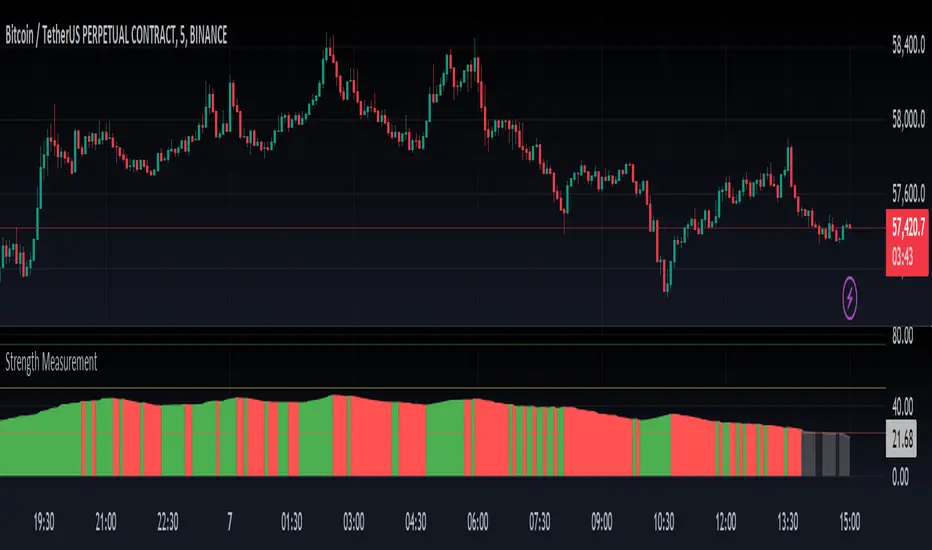
The Strength Measurement -HT indicator is a tool designed to measure the strength and trend of a security using the Average Directional Index (ADX) across multiple time frames. This script averages the ADX values from five different time frames to provide a comprehensive view of the trend's strength, helping traders make more informed decisions.
Key Features:
Multi-Time Frame Analysis: The indicator calculates ADX values from five different time frames (5 minutes, 15 minutes, 30 minutes, 1 hour, and 4 hours) to offer a more holistic view of the market trend.
Trend Strength Visualization: The average ADX value is plotted as a histogram, with colors indicating the trend strength and direction, making it easy to visualize and interpret.
Reference Levels: The script includes horizontal lines at ADX levels 25, 50, and 75 to signify weak, strong, and very strong trends, respectively.
How It Works
Directional Movement Calculation: The script calculates the positive and negative directional movements (DI+) and (DI-) using the true range over a specified period (default is 14 periods).
ADX Calculation: The ADX value is derived from the smoothed moving average of the absolute difference between DI+ and DI-, normalized by their sum.
Multi-Time Frame ADX: ADX values are computed for the 5-minute, 15-minute, 30-minute, 1-hour, and 4-hour time frames.
Average ADX: The script averages the ADX values from the different time frames to generate a single, comprehensive ADX value.
Trend Visualization: The average ADX value is plotted as a histogram with colors indicating:
Gray for weak trends (ADX < 25)
Green for strengthening trends (25 ≤ ADX < 50)
Dark Green for strong trends (ADX ≥ 50)
Light Red for weakening trends (ADX < 25)
Red for strong trends turning weak (ADX ≥ 25)
Usage
Trend Detection: Use the color-coded histogram to quickly identify the trend strength and direction. Green indicates a strengthening trend, while red signifies a weakening trend.
Reference Levels: Utilize the horizontal lines at ADX levels 25, 50, and 75 as reference points to gauge the trend's strength.
ADX < 25 suggests a weak trend.
ADX between 25 and 50 indicates a moderate to strong trend.
ADX > 50 points to a very strong trend.
Multi-Time Frame Insight: Leverage the averaged ADX value to gain insights from multiple time frames, helping you make more informed trading decisions based on a broader market perspective.
Feel free to explore and integrate this indicator into your trading strategy to enhance your market analysis and decision-making process. Happy trading!
Skript med en öppen källkod
In true TradingView spirit, the author of this script has published it open-source, so traders can understand and verify it. Cheers to the author! You may use it for free, but reuse of this code in publication is governed by House rules. Du kan ange den som favorit för att använda den i ett diagram.
Frånsägelse av ansvar
Informationen och publikationerna är inte avsedda att vara, och utgör inte heller finansiella, investerings-, handels- eller andra typer av råd eller rekommendationer som tillhandahålls eller stöds av TradingView. Läs mer i Användarvillkoren.