INVITE-ONLY SCRIPT
Cryptosmart Trading Tool (by heswaikcrypt)
Uppdaterad
Introducing the Cryptosmart Trading Tool (CSTP) - An optimized into Market Sentiment and direction tool
The Cryptosmart Trading Tool (CSTP) is an advanced indicator developed to provide valuable insights into market sentiment and direction. This tool combines existing TA tools and intelligently develops smart algorithms to empower traders with a deeper understanding of market dynamics. Some classic elements are included in the scripting, such as the exponential moving average (EMA), volume, and Relative Strength Index (RSI), to provide a comprehensive analysis of market conditions. By combining these indicators, the script aims to capture different aspects of market sentiment and enhance the accuracy of the analysis.
The Cryptosmart Trading Tool (CSTP) incorporates a unique algorithm that combines trend following analysis, momentum analysis, and volume analysis to provide insights into market sentiment and price action.
Trend Following Analysis:
https://www.tradingview.com/x/kPECwfvF/
Volume Analysis:
Major Flip and Arrow Plots:
The uniqueness of the CSTP algorithm lies in its combination of trend following analysis, momentum analysis, and volume analysis. By considering these factors, the algorithm provides insights into market sentiment and price action. The use of EMAs, RSIs, and volume ratios allows traders to identify potential trends, overbought/oversold conditions, and high volume activity. The visual representation of bar colors and arrows enhances the ease of understanding the sentiment and major flips. CSTP is uniquely presented by using dots, arrows, candlestick colors, and shape labels to indicate the market scenario. This is explained below.
By leveraging multiple indicators and analysis techniques, CSTP aims to provide traders with a holistic understanding of market dynamics and enhance their decision-making process.
It's important to note that while the individual components used in CSTP are not new or unique on their own, the specific algorithm, parameters, and calculations used within the script are what make it distinctive and valuable. By carefully integrating these components, CSTP generates results that are greater than the sum of its parts, providing traders with a comprehensive analysis of market conditions.
Through extensive research, analysis, and testing, we have created a useful tool, fine-tuned to optimize the accuracy and reliability of the script's output, which can assist traders in making more informed trading decisions.
How to Use:
1. Apply the CSTP Script:
- Apply the CSTP script to your TradingView chart to start analyzing market conditions. (Access instructions can be found in the author's details section.)
- Ensure you have the latest version of TradingView to access all the features and functionalities.
2. Customize Parameters:
- Customize the input variables to match your trading preferences and adapt the tool to different markets.
- Experiment with different settings, such as RSI Length and EMA Lengths, to find the optimal configuration for your trading strategy.
3. Interpret the Color-Coded Bars and Wave Labels:
- Green bars indicate bullish sentiment, suggesting potential buying opportunities.
- Red bars indicate bearish sentiment, indicating potential selling opportunities.
- Blue and white bars represent sentiment backed by smart money liquidity, adding an extra layer of analysis.
- The wave labels provide insights into market structure and potential wave patterns.
4. Combine with Candlestick philosophy strategy and parameters used:
- Wait for candlestick closure before making trading decisions based on CSTP's analysis.
- Consider the EMA (yellow) line as an additional tool to confirm entry or exit points.
- Combining CSTP's analysis with candlestick patterns can enhance your decision-making process and improve trade timing.
- Volume Analysis: Compares the current volume to the Simple Moving Average (SMA) of volume using the RSI Length parameter to determine high-volume periods.
- Color-Coded Bars: The color of the bars represents different market sentiments based on all the parameters used including Relative strength index, bullish and bearish
divergence and volume conditions.
- Open Close Cross (OCC) Alerts: Generates dot alert with color code (red=Bearish, green=Bullish) when there is a crossover or crossunder between the close and open
prices
Important Notes:
- Candlestick color matter a lot as then show the sentiment of the market at a given time. and it is an added advantage for a trader to understand candlestick Psychology.
Candlestick conditions
I will use this
 MTLUSDT chart to explain how it works

Long green Arrow: Bullish call, with green isBullish arrow
Long red Arrow: Bearish call, with isBearish arrow
Blue with red wick and tape: this indicate a bearish sentiment but with some bullish volume, this position is dice which requires a proper understanding of entry and exit. when if this said candle stick closes below the EMA line, wait for the the next candle after it t determining your move. If the next one closes above it, then the direction is still bullish, else the direction has flipped bearish. (special scenario: in the range or consolidative market phase, you may need to wait 3-7 day candle close before you decide. use the coloration as guide to help with your decision making).
Blue with green wick and tape: this indicated strong bullish sentiment backed by liquidity to push. it is important to not the candle close, if the candle closes above the EMA (7 and/or 21) that validates the move, else, you may need to wait for the next candle close to determine the move and momentum of the market. Example is the COOMPUST chart
White with green wick and tape: this works just like the "Blue candlestick with red wick and tape". follow same procedure
White with red wick and tape: White candle with red wick, indicates bearish sentiment backed by available market liquidity at the time.
If you see the market moving upward and the candlestick keep closing with white color, it is an indication of inorganic move (Check SUIUST) the best thing to do is to wait at resistance. a similar scenario can be seen here
Market test:
below are picture of the indicator tested on different assets
 BNB
BNB

AUD

Tesla

it is best to book an entry after an arrow indicate (especially for a bullish market) and the candle closes above the EMA (Yellow line).
Risk management.
- ALWAYS PROTECT YOUR PROFIT WHEN YOU SEE ON. THE MARKET IS DYNAMIC
- Trading involves risks, and no tool can guarantee absolute accuracy in predicting market direction. Conduct thorough research and exercise caution when making trading decisions.
- Apply proper risk management strategies and adjust position sizes according to your risk tolerance.
- Stay updated with market news and events that may impact your trading decisions.
Conclusion:
The Cryptosmart Trading Tool (CSTP) provides traders with a powerful advantage by offering valuable insights into market sentiment and direction. To gain access or trial, refer to the author's details section. This indicator combines various analysis techniques to provide a comprehensive view of the market. Remember to apply your own analysis and expertise in conjunction with CSTP for optimal results.
This indicator combines my 8years of trading experience. Enjoy
Disclaimer:
Trading involves risks, and the CSTP script is designed to assist traders by providing valuable insights. It should be used as a supplement to your own analysis and expertise. Exercise caution and make informed trading decisions based on your own research.
The Cryptosmart Trading Tool (CSTP) is an advanced indicator developed to provide valuable insights into market sentiment and direction. This tool combines existing TA tools and intelligently develops smart algorithms to empower traders with a deeper understanding of market dynamics. Some classic elements are included in the scripting, such as the exponential moving average (EMA), volume, and Relative Strength Index (RSI), to provide a comprehensive analysis of market conditions. By combining these indicators, the script aims to capture different aspects of market sentiment and enhance the accuracy of the analysis.
The Cryptosmart Trading Tool (CSTP) incorporates a unique algorithm that combines trend following analysis, momentum analysis, and volume analysis to provide insights into market sentiment and price action.
Trend Following Analysis:
- The algorithm utilizes two exponential moving averages (EMAs): EMA1 and EMA2.
- When EMA1 crosses above EMA2, it indicates an uptrend (isUptrend).
- When EMA1 crosses below EMA2, it indicates a downtrend.
- You adjust the input value to suit your trading strategy, however, 7, 8, 21, 34, and 200 have been tested to produce a fine tuned output.
- The bar color indicates blue for bullish sentiment (is uptrend) and white for bearish sentiment (is downtrend).
- Momentum Analysis:
- The relative strength index (RSI) is calculated based on the closing prices and the specified RSI length.
- RSI values above 70 indicate overbought conditions (isOverbought).
- RSI values below 30 indicate oversold conditions (isOversold).
- Using the isOversoldExtreme and isOverboughtExtreme, the CSTP algorithm detect extreme over bought and oversold conditions and alert with label color green and red.
https://www.tradingview.com/x/kPECwfvF/
Volume Analysis:
- The algorithm calculates the average volume over a specified length (averageVolume).
- The volume ratio is obtained by dividing the current volume by the average volume.
- High volume activity is identified when the volume ratio is greater than 1 (isHighVolume).
Major Flip and Arrow Plots:
- Major bullish or bearish flips are identified when EMA1 crosses above EMA2 with RSI values above 50 and high volume activity (isBullishFlip) or when EMA1 crosses below EMA2 with RSI values below 50 and high volume activity (isBearishFlip).
- Arrow plots are used to display trend direction, upward arrows for major bullish flips and downward arrows for major bearish flips.
- The algorithm calculates the bullBearRatio and RSIValueAtFlip to capture the volume ratio and RSI values at major flips.
- The bullishRatio and bearishRatio variables store the volume ratio values for the corresponding trend conditions.
- Labels are also displayed on the chart to provide information about EMA values and RSI values. This can be independently disabled by the user
The uniqueness of the CSTP algorithm lies in its combination of trend following analysis, momentum analysis, and volume analysis. By considering these factors, the algorithm provides insights into market sentiment and price action. The use of EMAs, RSIs, and volume ratios allows traders to identify potential trends, overbought/oversold conditions, and high volume activity. The visual representation of bar colors and arrows enhances the ease of understanding the sentiment and major flips. CSTP is uniquely presented by using dots, arrows, candlestick colors, and shape labels to indicate the market scenario. This is explained below.
By leveraging multiple indicators and analysis techniques, CSTP aims to provide traders with a holistic understanding of market dynamics and enhance their decision-making process.
It's important to note that while the individual components used in CSTP are not new or unique on their own, the specific algorithm, parameters, and calculations used within the script are what make it distinctive and valuable. By carefully integrating these components, CSTP generates results that are greater than the sum of its parts, providing traders with a comprehensive analysis of market conditions.
Through extensive research, analysis, and testing, we have created a useful tool, fine-tuned to optimize the accuracy and reliability of the script's output, which can assist traders in making more informed trading decisions.
How to Use:
1. Apply the CSTP Script:
- Apply the CSTP script to your TradingView chart to start analyzing market conditions. (Access instructions can be found in the author's details section.)
- Ensure you have the latest version of TradingView to access all the features and functionalities.
2. Customize Parameters:
- Customize the input variables to match your trading preferences and adapt the tool to different markets.
- Experiment with different settings, such as RSI Length and EMA Lengths, to find the optimal configuration for your trading strategy.
3. Interpret the Color-Coded Bars and Wave Labels:
- Green bars indicate bullish sentiment, suggesting potential buying opportunities.
- Red bars indicate bearish sentiment, indicating potential selling opportunities.
- Blue and white bars represent sentiment backed by smart money liquidity, adding an extra layer of analysis.
- The wave labels provide insights into market structure and potential wave patterns.
4. Combine with Candlestick philosophy strategy and parameters used:
- Wait for candlestick closure before making trading decisions based on CSTP's analysis.
- Consider the EMA (yellow) line as an additional tool to confirm entry or exit points.
- Combining CSTP's analysis with candlestick patterns can enhance your decision-making process and improve trade timing.
- Volume Analysis: Compares the current volume to the Simple Moving Average (SMA) of volume using the RSI Length parameter to determine high-volume periods.
- Color-Coded Bars: The color of the bars represents different market sentiments based on all the parameters used including Relative strength index, bullish and bearish
divergence and volume conditions.
- Open Close Cross (OCC) Alerts: Generates dot alert with color code (red=Bearish, green=Bullish) when there is a crossover or crossunder between the close and open
prices
Important Notes:
- Candlestick color matter a lot as then show the sentiment of the market at a given time. and it is an added advantage for a trader to understand candlestick Psychology.
Candlestick conditions
I will use this
Long green Arrow: Bullish call, with green isBullish arrow
Long red Arrow: Bearish call, with isBearish arrow
Blue with red wick and tape: this indicate a bearish sentiment but with some bullish volume, this position is dice which requires a proper understanding of entry and exit. when if this said candle stick closes below the EMA line, wait for the the next candle after it t determining your move. If the next one closes above it, then the direction is still bullish, else the direction has flipped bearish. (special scenario: in the range or consolidative market phase, you may need to wait 3-7 day candle close before you decide. use the coloration as guide to help with your decision making).
Blue with green wick and tape: this indicated strong bullish sentiment backed by liquidity to push. it is important to not the candle close, if the candle closes above the EMA (7 and/or 21) that validates the move, else, you may need to wait for the next candle close to determine the move and momentum of the market. Example is the COOMPUST chart
White with green wick and tape: this works just like the "Blue candlestick with red wick and tape". follow same procedure
White with red wick and tape: White candle with red wick, indicates bearish sentiment backed by available market liquidity at the time.
If you see the market moving upward and the candlestick keep closing with white color, it is an indication of inorganic move (Check
Market test:
below are picture of the indicator tested on different assets
AUD
Tesla
it is best to book an entry after an arrow indicate (especially for a bullish market) and the candle closes above the EMA (Yellow line).
Risk management.
- ALWAYS PROTECT YOUR PROFIT WHEN YOU SEE ON. THE MARKET IS DYNAMIC
- Trading involves risks, and no tool can guarantee absolute accuracy in predicting market direction. Conduct thorough research and exercise caution when making trading decisions.
- Apply proper risk management strategies and adjust position sizes according to your risk tolerance.
- Stay updated with market news and events that may impact your trading decisions.
Conclusion:
The Cryptosmart Trading Tool (CSTP) provides traders with a powerful advantage by offering valuable insights into market sentiment and direction. To gain access or trial, refer to the author's details section. This indicator combines various analysis techniques to provide a comprehensive view of the market. Remember to apply your own analysis and expertise in conjunction with CSTP for optimal results.
This indicator combines my 8years of trading experience. Enjoy
Disclaimer:
Trading involves risks, and the CSTP script is designed to assist traders by providing valuable insights. It should be used as a supplement to your own analysis and expertise. Exercise caution and make informed trading decisions based on your own research.
Versionsinformation
Optimed the extreme values and removed the label noise on the chart.Versionsinformation
Bullishness and bearish flip optimizedVersionsinformation
Entry line updated.Versionsinformation
Extreme alert data optimized and,Heatmap label added to show buy and sell volume on all timeframes
Versionsinformation
Extreme alert data finetuned.the green and red heatmap cloud shows money inflow and outflow respectively
Versionsinformation
label and 30 minute entry caution alert integratedVersionsinformation
This latest Latest update is majorly for scalp tradersit includes entry and exit alert using a Triangle symbol to indicate buy or sell
where;
Green triangle == Buy and,
Red triangle == Sell.
It works on all timeframe just follow alert and protect your profit when you see it.
Note that you still need to take the candlestick colors (Blue and White) into consideration when trading and it is best to wait for a retest of the Yellow line before you enter a trade long-term.
Don't forget to trade smartly.
Versionsinformation
Latest update includes:CSTP (by Heswaikcrypt) title now STIC (by @heswaicrypt) ,Meaning, Smart Trading and Investment Companion
This are extreme market indicator label colors
*Buy state*
light green Extreme level 1
Light blue Extreme level 2
Green Extreme level 3
*Sell state*
Light Red Extreme level 1
Pink Extreme level 2
Red Extreme level 3
Also,
Fibonacci retracement plotter has been included as a guide to help with support and resistance while I remove the previous algorithm I used to determine support and resistance, which was not very effective.
Please note that on 4H timeframe, you should manually go to settings and enable <reverse> as it doesn't work well on 4H but works well on other timeframes
Also, the background colors has been included for bullish and bearish phase. Green for bullish and Red for bearish
Please take note.
Versionsinformation
To ensure clarity on the Extreme Alerts, I have included text in the label. EL1 = Extreme level 1
EL2 = Extreme level 2
EL3 = Extreme level 3
Versionsinformation
To ensure clarity on the Extreme Alerts, I have included text in the label. EL1 = Extreme level 1
EL2 = Extreme level 2
EL3 = Extreme level 3
Versionsinformation
I'm super excited about this latest update, Unpdate feature:
- Triangle alert smoothed and much better now with improved algorithm for optimal output
- The Bullish and Bearish flip has been updated as well.
- Special Extreme alert scenario: (Yellow tested label ) once you see it, it is a signal of correction and you can scalp the reversal. It doesn't always come out except on special cases (sharp market extreme conditions). so use smartly, it is subject to further smoothening.
- Lastly, Alert conditions has been included to help you setup trade alert. Pay critical attention to timeframe when using it.
if you are using light mode,
you can manually change the color of your yellow line to another color to make it more obvious, you will see Flip line under settings
Versionsinformation
this update includes optimzation of the alert signal and addition of more alert conditions to potential buy and sell conditions, market flip conditions, possibly entry/exit conditionsVersionsinformation
Alert conditions optimizedVersionsinformation
Alert conditons updated and optimised.Versionsinformation
Buy and sell potenting alert mesage updated.Versionsinformation
The latest update on the STIC tool includes a fine-tuning of the buy and sell alert potential script that also includes the ticker, price, volume, and timeframe of each trade alert.Versionsinformation
Long and short text added to buy and sell potential trianglesVersionsinformation
Trades alert feature updated for all alerts, including fib levelsVersionsinformation
I've made a few updates to the candle color and alert.We now have:
Blue-green: Bullish Smart money inflow
Blue-red: Potential bearish correction to the Flip line
White-red: Bearish smart money outflow
White-green: Bearish smart money with bullish potential.
Yellow-red or Blue red: Potential Bearish Correction
Yellow-green: Bullish entry sentiment with potential bearish correction tendency (meaning a a yellow-green candle bullishness is valid until a bearish candle appears)
Red-green or Solid red: neutral market state
Grey-green: Potential bullish inflow or uptrend.
Grey-red: grey-green is invalidated until a bullish candle shows up.
Take some Profit: Extreme level to take the same profit.
Understanding candlestick psychology (e.g., bullish or bearish engulfing, evening and morningstar, etc.) is important. The video is available on my YouTube channel.
🚨Note: The Buy/sell alert] and the Flip line is still very important in your analysis. A confirmative close above the flip line indicated a bullish market flip, and vice versa. Don't FOMO.
#tradesmartly #STICindicator
Versionsinformation
Added new entry and exit alerts/triggers to help when a potential buy triangle trade is missed or you are late to Buy/Sell potential alert party (green/red triangle respectively), you can wait for the trigger before you book an entry. It has a blue label for the buy/long trigger and a yellow label for the sell/short trigger, as shown on the updated chart.
#Tradesmartly
Versionsinformation
flip line optimizedVersionsinformation
This update includes:Optimization of the buy and sell potentila alert and reducation of noisy triggers
also the alert symbol has been changed to diamond instrad of triangle.
Enjoy.
Versionsinformation
Buy/Sell alert bug fixedAlert conditions and alert messages optimized accordingly
Versionsinformation
Extreme alert fine tuned as well as alert conditionsVersionsinformation
As a smart trader, you'll understand institutional/smart money traders likes to hunt liquidation prices, hence the need to prepare and plan your trades to take advantage of their moves or hunt.Over the past few month, I've iterated and developed a better way to make STIC more user-friendly while removing noise from the alert..
Initially you get a lot of Buy and Sell alert as the market meets this condition but not all the buys and sell are valid as they can get you induced into entering trades too early, also the Fibonacci plot way scatter your chart while making it look too noise to too many information (so I feel STIC trader should learn how to use Fibonacci retracement (so I've deprecated it).
To help traders get better hedge in making trade decision i have made the following updates which includes;
- A noiseless chart with valid Buy and Sell alert plot
- Trader's sentiment colors where Blue and yellow are Bullish while White and Red are Bearish on all timeframes. and
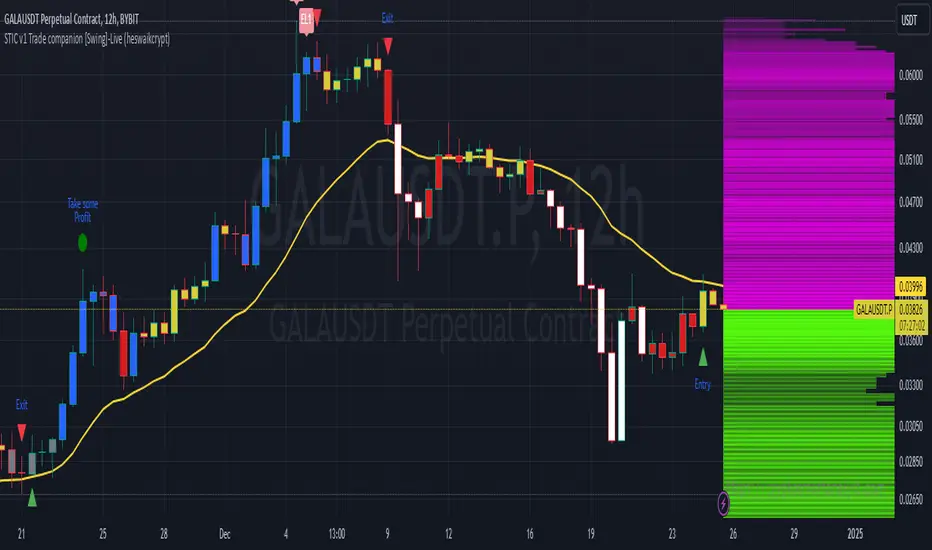
- Now with STIC v1, you can see all the potential liquidity and resting liquidation regions (from 100 candles backward (which you can change the value to minimum of 50 and maximum 500 in the indicator settings {Number of Candlestick Lookback}).
You can see the plot in the
plotted out as the histogram is liquidity.
Green represent bullish liquidity and magenta represent Bearish liquidity. The longer, wider and thicker the color of the histogram is, the larger the liquidity at the region.
Remember, patience is very important in trading, if you miss a very vital entry, just leave the chart or look for another asset to analyze.
#Tradesmartly
Versionsinformation
Bug associated with Buy and sell triangle alert fixed. It is best to pick the 1st entry signal, if you miss it, stay patient and protect whatever position you have.
#tradesmartly.
Endast inbjudanskript.
Tillgången till detta skript är begränsat till användare som har godkänts av författaren och kräver vanligtvis betalning. Du kan lägga till det till dina favoriter men du kan bara använda det efter att ha begärt och fått författarens tillstånd. Contact Heswaikcrypt for more information, or follow the author's instructions below.
TradingView does not suggest paying for a script and using it unless you 100% trust its author and understand how the script works. In many cases, you can find a good open-source alternative for free in our Community Scripts.
Författarens instruktioner
″Get 7-day free access to try it out by creating a free account here
https://cryptosmartanalyst.com and join our free telegram community below.
Here is the link to our free TA and FA channels: https://t.me/addlist/Wr_UINpxPrZlNW
#Tradesmartly
Vill du använda det här skriptet i ett diagram?
Warning: please read before requesting access.
#SmartAnalyst
access- cryptosmartanalyst.com
access- cryptosmartanalyst.com
Frånsägelse av ansvar
Informationen och publikationerna är inte avsedda att vara, och utgör inte heller finansiella, investerings-, handels- eller andra typer av råd eller rekommendationer som tillhandahålls eller stöds av TradingView. Läs mer i Användarvillkoren.