OPEN-SOURCE SCRIPT
Horizontal Lines 0.5, BY ROSHAN SINGH
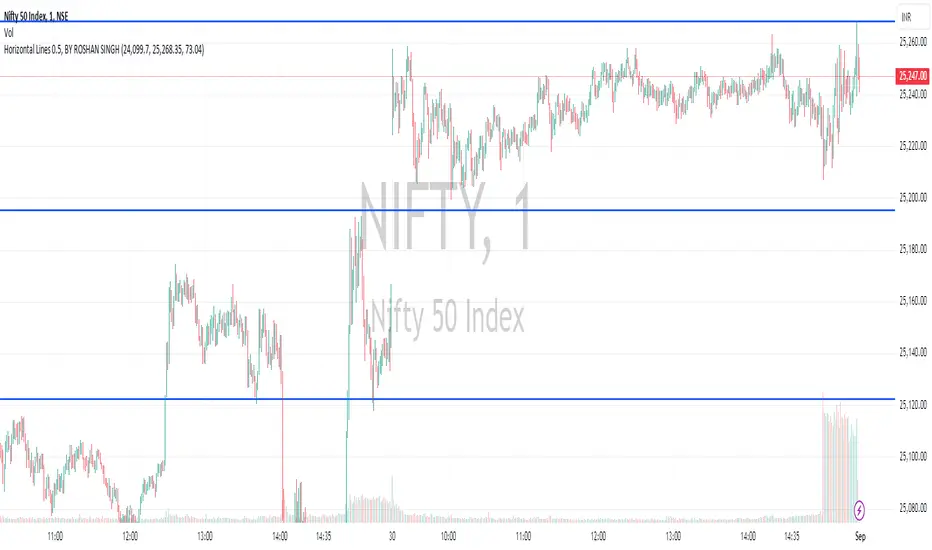
This indicator identify support and resistance to trade in 1min time frame, based of fib 0.5 level, on 15 min time frame find major high and low means major swing, low will be our start level and high will be our end level input in setting, substract high and end level and now divide answer with 2 till the daily volatility of a index or stock, if saying about nifty suppose nifty daily travel minimum for 65 pts then interval will be 65 input in settings, now all horizontals lines means support and level will be plotted on chart, buy on support, sell on resistance
Skript med en öppen källkod
In true TradingView spirit, the author of this script has published it open-source, so traders can understand and verify it. Cheers to the author! You may use it for free, but reuse of this code in publication is governed by House rules. Du kan ange den som favorit för att använda den i ett diagram.
Frånsägelse av ansvar
Informationen och publikationerna är inte avsedda att vara, och utgör inte heller finansiella, investerings-, handels- eller andra typer av råd eller rekommendationer som tillhandahålls eller stöds av TradingView. Läs mer i Användarvillkoren.