OPEN-SOURCE SCRIPT
Pink's Daily SMA Script
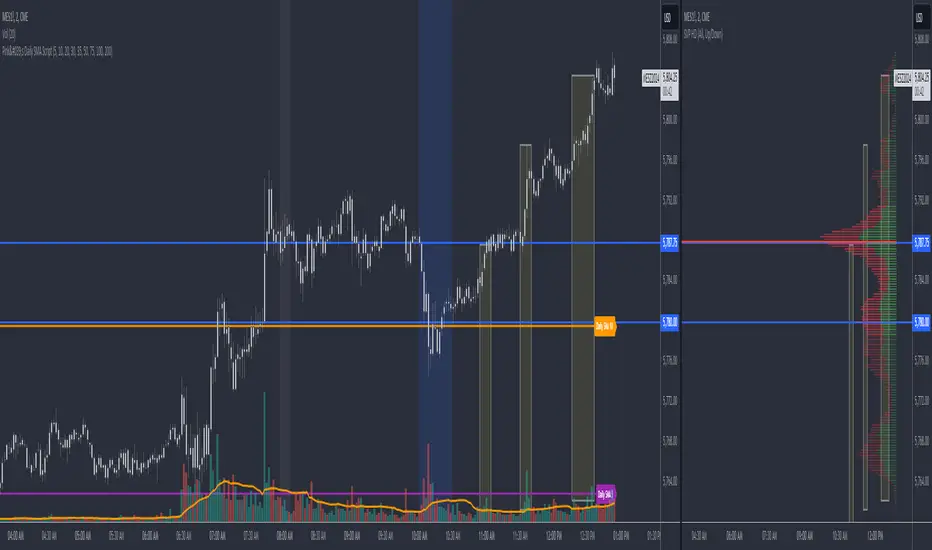
📊 The script calculates daily SMA values using the request.security() function and plots them as horizontal lines on the chart. These SMAs are updated once per day, typically at the start of the pre-market session (9:00 AM in the "America/New_York" timezone). The script resets the SMA values at the start of each new day, ensuring fresh data for daily analysis.
🕒 In addition to the SMAs, the script includes an optional feature that highlights specific time ranges on the chart: from 11:00 AM to 11:05 AM and from 1:00 PM to 1:30 PM (based on the "America/New_York" timezone). Users can toggle these background highlights on or off, providing visual cues for key times during the trading day. The 11:00 AM window is highlighted in gray, while the 1:00 PM window is highlighted in blue.
🔖 The SMAs are labeled on the right side of the chart, with only one label visible at a time for each SMA. These labels display the length of the respective SMA, and their colors match the lines drawn on the chart, helping to distinguish between the different SMAs.
Special thanks to Pinks333 (tradingview.com/u/pinks333/
Who provided the logic for the script and was willing to share her logic and open source the script.
Skript med en öppen källkod
In true TradingView spirit, the author of this script has published it open-source, so traders can understand and verify it. Cheers to the author! You may use it for free, but reuse of this code in publication is governed by House rules. Du kan ange den som favorit för att använda den i ett diagram.
Frånsägelse av ansvar
Informationen och publikationerna är inte avsedda att vara, och utgör inte heller finansiella, investerings-, handels- eller andra typer av råd eller rekommendationer som tillhandahålls eller stöds av TradingView. Läs mer i Användarvillkoren.