OPEN-SOURCE SCRIPT
Spread Analyzer
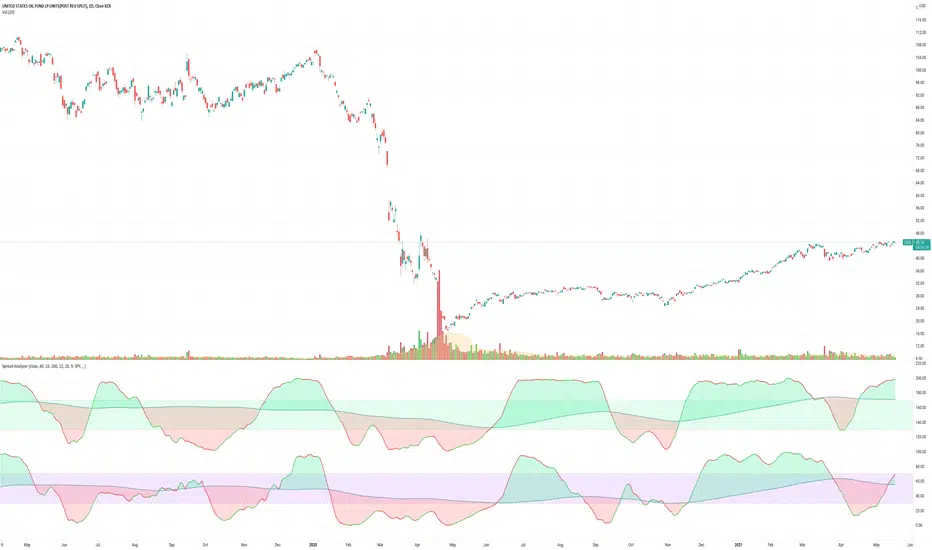
This script plots the relative performance of the viewed security with respect to a selected benchmark. It can be used to identify assets higher than market average potential.
- The plot above is the relative volume.
- The plot below is the relative performance.
Computation is done by applying stochastic to the spread of the asset's current price/obv value to the benchmark defined by the Part1, 2 and 3.
The benchmark can be a portfolio as well:
Part1 = 4*SPY+2*QQQ
Part2 = XAUUSD+EURUSD
-PS: Each part may contain up to 10 symbols.
- The spread is calculated with the following formula
close / (Part1 + Part2 + Part3)
- Color code is based on the stochastic of macd of the spread.
The inputs:
length : lookback length for the stochastic
lenk : Smoothing factor(K) for stochastic
lend : EMA length(D)
MACD Fast / Slow / Smooth : MACD parameters used to determine the color code
Skript med en öppen källkod
In true TradingView spirit, the author of this script has published it open-source, so traders can understand and verify it. Cheers to the author! You may use it for free, but reuse of this code in publication is governed by House rules. Du kan ange den som favorit för att använda den i ett diagram.
Frånsägelse av ansvar
Informationen och publikationerna är inte avsedda att vara, och utgör inte heller finansiella, investerings-, handels- eller andra typer av råd eller rekommendationer som tillhandahålls eller stöds av TradingView. Läs mer i Användarvillkoren.