OPEN-SOURCE SCRIPT
Inverted SD Dema RSI | viResearch
Inverted SD Dema RSI | viResearch
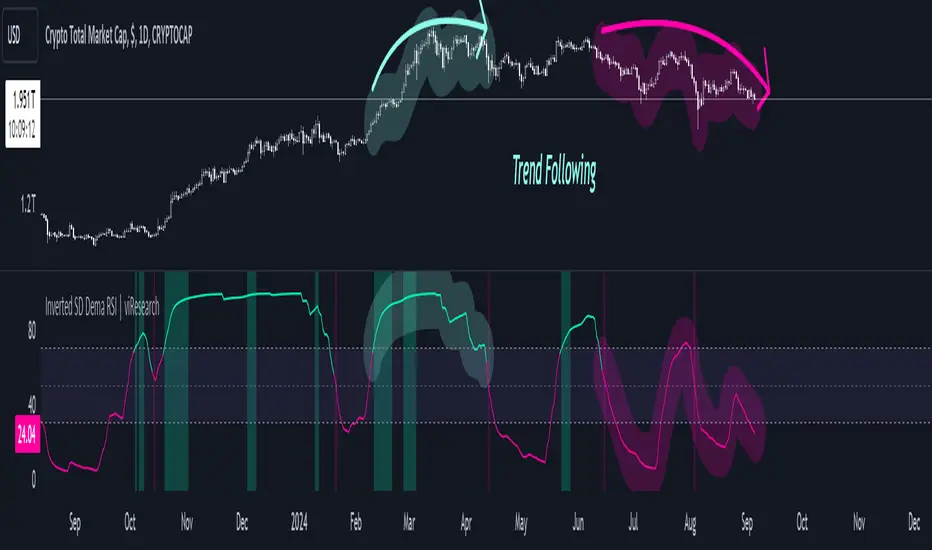
The "Inverted SD Dema RSI" developed by viResearch introduces a new approach to trend analysis by combining the Double Exponential Moving Average (DEMA), Standard Deviation (SD), and Relative Strength Index (RSI). This unique indicator provides traders with a tool to capture market trends by integrating volatility-based thresholds. By using the smoothed DEMA along with standard deviation, the indicator offers improved responsiveness to price fluctuations, while RSI thresholds offer insight into overbought and oversold market conditions.
At the core of the "Inverted SD Dema RSI" is the combination of DEMA and standard deviation for a more nuanced view of market volatility. The use of RSI further aids in detecting price extremes and potential trend reversals.
DEMA Calculation (sublen): The Double Exponential Moving Average (DEMA) smoothes out price data over a user-defined period, reducing lag compared to traditional moving averages. This provides a clearer representation of the market's overall direction.
Standard Deviation Calculation (sublen_2): The standard deviation of the DEMA is used to define the upper (u) and lower (d) bands, highlighting areas where price volatility may signal a change in trend. These dynamic bands help traders gauge price volatility and potential breakouts or breakdowns.
RSI Calculation (len): The script applies the Relative Strength Index (RSI) to the smoothed DEMA values, allowing traders to detect momentum shifts based on a modified data set. This provides a more accurate reflection of market strength when combined with the DEMA.
Thresholds: The RSI is compared to user-defined thresholds (70 for overbought and 55 for oversold conditions). These thresholds help in identifying potential market reversals, especially when the price breaks outside of the calculated standard deviation bands.
Uptrend (L): An uptrend signal is generated when the RSI exceeds the upper threshold (70) and the price is not above the upper standard deviation band, indicating that there may be room for further price appreciation.
Downtrend (S): A downtrend signal occurs when the RSI falls below the lower threshold (55), indicating that the price may continue to decline.
The "Inverted SD Dema RSI" offers a wide range of customizable settings, allowing traders to adjust the indicator based on their trading style or market conditions.
DEMA Length (sublen): Controls the period used to smooth the price data, impacting the sensitivity of the DEMA to recent price movements.
Standard Deviation Length (sublen_2): Defines the length over which the standard deviation is calculated, helping traders control the width of the upper and lower bands.
RSI Length (len): Adjusts the period used for the RSI calculation, providing flexibility in determining overbought and oversold conditions.
RSI Thresholds: Traders can define their own levels for detecting trend reversals, with default values of 70 for an uptrend and 55 for a downtrend.
The "Inverted SD Dema RSI" is particularly well-suited for traders looking to capture trends while accounting for volatility and momentum. By using a smoothed DEMA as the foundation, it effectively filters out noise, making it ideal for detecting reliable trends in volatile markets.
Key Uses:
Trend Following: The indicator’s combination of DEMA, standard deviation, and RSI helps traders follow trends more effectively by reducing noise and identifying key momentum shifts.
Volatility Filtering: The use of standard deviation bands provides a dynamic measure of volatility, ensuring that traders are aware of potential breakouts or breakdowns in the market.
Momentum Detection: The inclusion of RSI ensures that the indicator is not only focused on trend direction but also on the strength of the underlying momentum, helping traders avoid entering trades during weak trends.
The "Inverted SD Dema RSI" provides several key advantages over traditional trend-following indicators:
Reduced Lag: The use of DEMA ensures faster trend detection, reducing the lag associated with simple moving averages.
Noise Reduction: The integration of standard deviation helps filter out irrelevant price movements, making it easier to identify significant trends.
Momentum Awareness: The addition of RSI provides valuable insight into the strength of trends, helping traders avoid false signals during periods of weak momentum.
The "Inverted SD Dema RSI" offers a powerful blend of trend-following and momentum detection, making it a versatile tool for modern traders. By integrating DEMA, standard deviation, and RSI, the indicator provides a comprehensive view of market trends and volatility. Traders are encouraged to experiment with different settings for the DEMA length, standard deviation, and RSI thresholds to fine-tune the indicator for their specific trading strategies. Whether used for trend confirmation, volatility assessment, or momentum analysis, the "Inverted SD Dema RSI" offers a valuable tool for traders seeking a comprehensive approach to market analysis.
Skript med en öppen källkod
In true TradingView spirit, the author of this script has published it open-source, so traders can understand and verify it. Cheers to the author! You may use it for free, but reuse of this code in publication is governed by House rules. Du kan ange den som favorit för att använda den i ett diagram.
Frånsägelse av ansvar
Informationen och publikationerna är inte avsedda att vara, och utgör inte heller finansiella, investerings-, handels- eller andra typer av råd eller rekommendationer som tillhandahålls eller stöds av TradingView. Läs mer i Användarvillkoren.