INVITE-ONLY SCRIPT
Heatmap - Support & Resistance (Volume Clusters)
Uppdaterad
Heatmap - Support & Resistance (Volume Clusters)
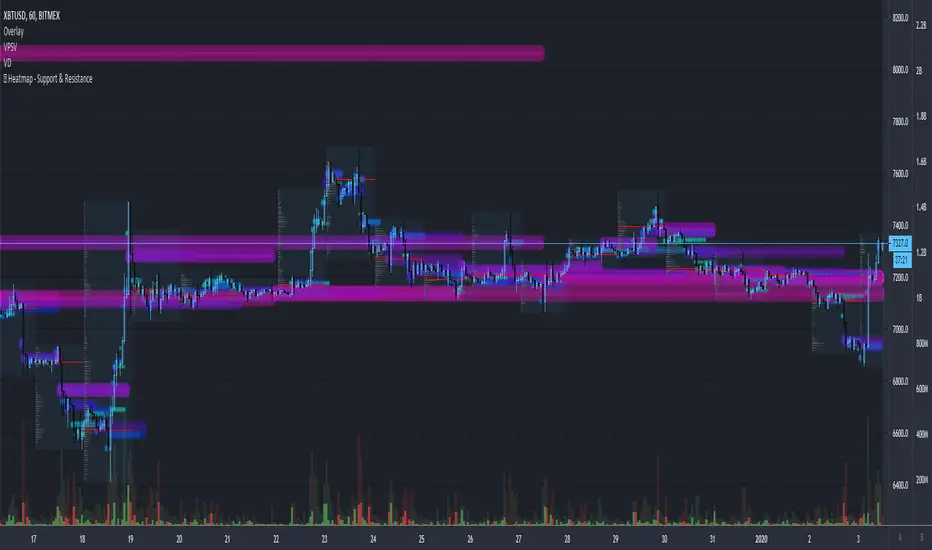
The Heatmap is based on the real traded volume.
The Heatmap can help identify the levels of Support and Resistance, thus validating other indicators' Oversold or Overbought conditions.
Small blocks don't have much significance. On the other hand, bigger and brighter ones would mean strong levels of Support or Resistance.
Alerts are available to be set to fire whenever the Support or Resistance levels are reached.
Related tools:
• Volume Delta
• CVD
• Counters Ratio
Versionsinformation
added a Noise Filter.Versionsinformation
added option - 5min chart intervalJoin the Discord Server for more info about the published tools.
discord.io/CryptoWorld
a Discord bot for Charting (TradingView and Heatmaps) is available
🟣 If you like any of my Invite-Only Tools, let me know
(DM or Discord for inquiries)
discord.io/CryptoWorld
a Discord bot for Charting (TradingView and Heatmaps) is available
🟣 If you like any of my Invite-Only Tools, let me know
(DM or Discord for inquiries)
Endast inbjudanskript.
Tillgången till detta skript är begränsat till användare som har godkänts av författaren och kräver vanligtvis betalning. Du kan lägga till det till dina favoriter men du kan bara använda det efter att ha begärt och fått författarens tillstånd. Contact KryptoNight for more information, or follow the author's instructions below.
Please note that this is a private, invite-only script that was not analyzed by script moderators. Its compliance to House Rules is undetermined. TradingView does not suggest paying for a script and using it unless you 100% trust its author and understand how the script works. In many cases, you can find a good open-source alternative for free in our Community Scripts.
Vill du använda det här skriptet i ett diagram?
Warning: please read before requesting access.
Frånsägelse av ansvar
Informationen och publikationerna är inte avsedda att vara, och utgör inte heller finansiella, investerings-, handels- eller andra typer av råd eller rekommendationer som tillhandahålls eller stöds av TradingView. Läs mer i Användarvillkoren.