OPEN-SOURCE SCRIPT
Timeframe Watermark
Uppdaterad
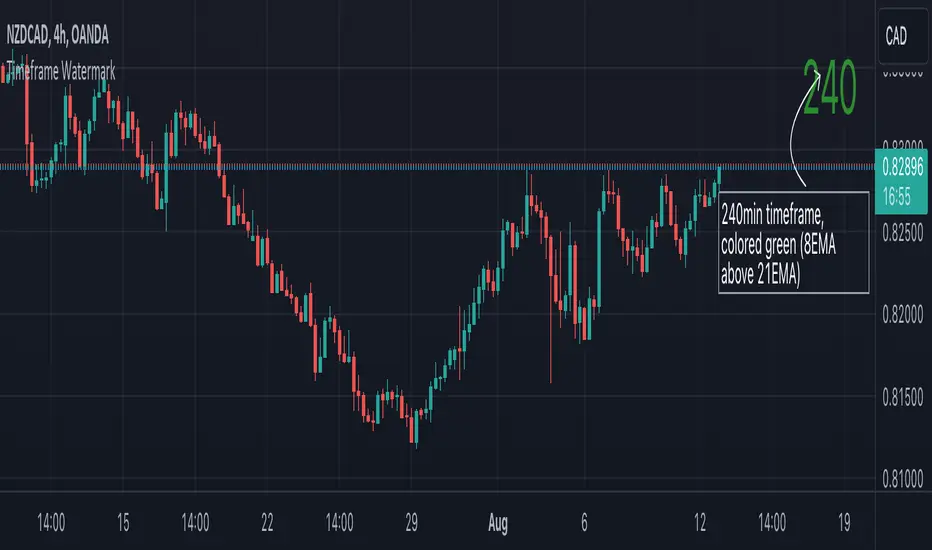
A small indicator designed for the minimalist chartist which prints the timeframe on your chart. The color of the text is based on whether the currency is trending (using the 8 and 21 EMAs) in that timeframe. Trending here is simply defined as the direction in which the 8 is above or below the 21. When used in a multi-timeframe layout, this indicator lets you easily scan multiple charts to see if they are trending across multiple timeframes by looking at the color of each chart's timeframe stamp.
This is designed to be used in a multi-timeframe window layout to efficiently and minimally present trending information across multiple timeframes.
Features:
adjustable colors
adjustable text position within the chart (top left/middle/right, bottom left/middle/right)


This is designed to be used in a multi-timeframe window layout to efficiently and minimally present trending information across multiple timeframes.
Features:
adjustable colors
adjustable text position within the chart (top left/middle/right, bottom left/middle/right)
Versionsinformation
A small indicator designed for the minimalist chartist which prints the timeframe on your chart. The color of the text is based on whether the currency is trending (using the 8 and 21 EMAs) in that timeframe. Trending here is simply defined as the direction in which the 8 is above or below the 21. When used in a multi-timeframe layout, this indicator lets you easily scan multiple charts to see if they are trending across multiple timeframes by looking at the color of each chart's timeframe stamp.This is designed to be used in a multi-timeframe window layout to efficiently and minimally present trending information across multiple timeframes.
Features:
adjustable colors
adjustable text position within the chart (top left/middle/right, bottom left/middle/right)
Skript med en öppen källkod
In true TradingView spirit, the author of this script has published it open-source, so traders can understand and verify it. Cheers to the author! You may use it for free, but reuse of this code in publication is governed by House rules. Du kan ange den som favorit för att använda den i ett diagram.
Frånsägelse av ansvar
Informationen och publikationerna är inte avsedda att vara, och utgör inte heller finansiella, investerings-, handels- eller andra typer av råd eller rekommendationer som tillhandahålls eller stöds av TradingView. Läs mer i Användarvillkoren.